|
|
|
Observing Snow
|
Glacier
Investigations
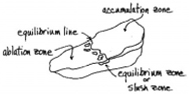
Comparing a
glacier's accumulation area with its total
area gives an estimate of its health. The
boundary between the accumulation zone and
ablation zone is called the equilibrium
line
From "Glaciers of North America" by
Sue Ferguson
A glacier is a river of ice flowing under
its own weight. It pushes large amounts of silt,
gravel, and rock as it travels. Over a period of
many years snow accumulations become deep enough to
form glacier ice, which flows because of its own
weight.
Glaciers form in conditions where snow
accumulates in successive years and does not
completely melt during summer months. Eventually
the snow crystals are subject to pressure
metamorphism from the growing weight of the
overlying snow and melt - freeze
metamorphism from fluctuating warmer and cooler
temperatures. The change from small individual ice
grains to the very large, dense, and compressed
glacial ice crystals forms a mass of ice through
the process known as firnification. Under
favorable conditions glacial ice crystals may reach
a diameter of 30 centimeters.
Glaciers accumulate new ice from snowfall in
winter months and lose ice during melting that
occurs in summer months. Accumulation of ice occurs
in the higher altitudes in a region called the
accumulation zone, and loss occurs at the
lower latitudes, in a region called the ablation
zone. The point where these two regions meet is
called the equilibrium line and marks the
highest level of retreat of winter snow. The
equilibrium line varies from place to place
and from year to year depending on the climate. If
accumulation is greater than ablation, the glacier
will grow or advance, and if ablation is
greater than accumulation the glacier will shrink
or retreat. Whether a glacier is growing or
shrinking is determined at the equilibrium line,
not at the terminus.
|
|
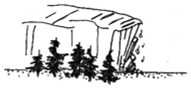
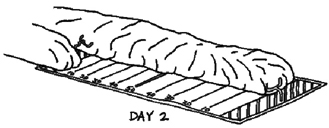
The snout of an advancing glacier is often bulbous
with a steep face
|
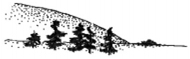
The snout of a retreating glacier usually has a
shallow slope that gradually thins.
|
From "Glaciers of North America" by Sue Ferguson
|
Chapter
Science
Content
Standards
A-4,5,7 |
It is hard to imagine a glacier moving, but they do in fact travel
downhill under the force of gravity and the weight of the large ice
mass. Distances from centimeters to meters per day are common. The
bottom surface of the glacier slides along the bedrock aided by
lubricating melt water in a process know as basal sliding. The
ice mass itself also flows internally without breaking in a process
called ductile deformation. Friction is greatest on the bottom
and the sides because these are the surfaces contacting rock.
Friction explains why glaciers move more quickly on the surface. One
can visualize the layers flowing at different rates similar to the
way cards slide past one another as you spread a deck.
Sometimes glaciers flow very rapidly or over steep terrain that
creates ice falls. The ice crystals cannot be stretched to that
degree. Brittle deformation occurs when a glacier's movement
is so severe that the ice mass breaks, often forming deep crevasses.
Normal glacier movement is usually in the neighborhood of
centimeters per day. A surging glacier can move 100 yards per
day or more in extreme conditions. The internal " plumbing" of the
glacier somehow becomes dammed . Glacial melt water cannot flow
freely. A cushion of water develops and greatly reduces the friction
of the large ice mass. Usually the surging motion itself breaks the
melt water dam and the surging motion stops abruptly. Although the
terminus of the glacier moves dramatically the overall total
glacial volume is not increased. The Mapping Exercise in this
chapter measures the movement of the Peter's Glacier during the 1986
-1987 surge.
When a glacier surges it can move ten to one hundred times
faster than its normal rate of motion. This could cause a glacier,
which normally moves the length of a football field in one year, to
move that same distance in one day!
From "Glaciers of North America" by Sue Ferguson
|
The general health of the world's glaciers can be an
indicator of broad global climate change. Over geological
history the Earth's climate has cooled several times so that
smaller systems of mountain glaciers were slowly
overcome and absorbed in an advancing ice sheet that
at times covered much of North America. Today the only
remaining ice sheets are in Greenland and Antarctica.
Scientists study glaciers to determine the rate and effects
of global warming. A tremendous amount of frozen water is
stored in the world's glaciers. Significant melting could
have the potential to raise sea level and flood many
valuable inhabited areas.
|
The Cordilleran Ice Sheet once covered nearly
all of the mountains in southern Alaska, western Canada, and
the western United States
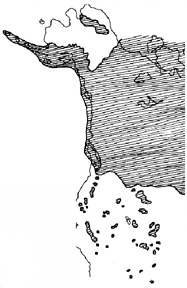
From "Glaciers of North America" by Sue
Ferguson
|
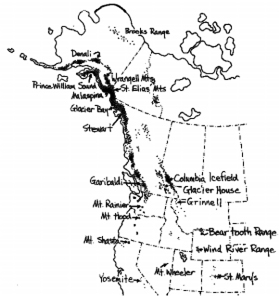
This map shows the approximate location of today's
mountain glaciers
From "Glaciers of North America" by Sue
Ferguson
|
Geography
Content
Standards
A- 1,3 |
|
English /
Language
Arts
Content
Standard
B-1 |
Glacier Slide
Show
In order to tap into a variety of learning styles the
glacier information is organized into a slide lecture
including not only photographs, but maps, graphs, and
scientific illustrations. The last few slides are of the
Peter's Glacier, used in the next exercise to teach map
skills and to calculate its flow rate during the 1986-87
surging episode.
This activity is presented with special thanks to
Dennis Trabant from the USGS Water Resources Division and
Keith Echelmeyer from the UAF Geophysical Institute for
providing slides, aerials photos, and lots of ideas and
information.
All of the slides
or
Slides one at a time |
|
Technology
Content
Standard
A -2
C - 1, 2, 3
|
Activity: Glacier
Mapping
The initial introduction to mapping works well using
two stations.
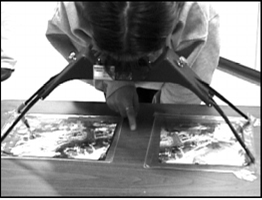
At the first station students learn to use
a stereoscope which renders the aerial photo in
three dimensions. Here we are tracing ridges and
drainages with our fingers.
|
Station One:
Students are introduced to a stereoscope, a tool
that renders a three dimensional image by pairing
two adjacent aerial photos. The class will map the
Peter's Glacier surge from a series of aerial
photographs. The stereoscopic image should help
bridge the gap between the photographs presented in
the slide show and an aerial photo showing a top or
"map" view. The aerial photo is the flattened view
of the stereoscopic image,and works well as a
mapping tool. The class will map the Peter's
Glacier surge from a series of aerial photographs.
|
|
|
Geography
Content
Standard
A -1, 4 |
|
Station Two:
A physical map of Denali National Park is
displayed side by side with the satellite map of
the Park. The teacher helps the student identify
ridges, drainages, the Peter's Glacier, and its
terminal moraine. It is helpful to point out and
discuss the concept of map scale and contour lines.
|
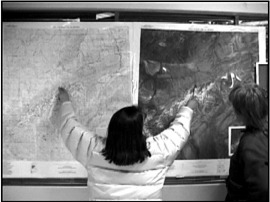
In Station Two students are guided in
interpreting both a topographic map and satellite
map.
|
Open Note Review: Students who are not visiting
either of the stations are directed to remain at their seats
and work on an Open Note Review included at the end of this
chapter. It is a comprehensive review of the material
covered in the science section of the program. Students are
encouraged to help each other and ask questions of the
instructors in order to complete the entire review sheet.
|
Activity: Mapping the Surge Rate
of the Peters Glacier
|
Materials:
Land Sat poster of Denali Park, features
marked
Topographic Map of Denali Park
Stereoscope
Color aerial photos for use with
Stereoscope
Overhead Projector
Overhead Transparency of PRE surge
Overhead Transparency of
POST surge
Four color overhead pens
Mylar (one sheet per student)
Colored Pencils
(Four colors per student)
Paper clips (Four per student)
Aerial photo PRE surge (one per student)
Aerial photo POST surge (one per student)
Ruler
Calculator
|
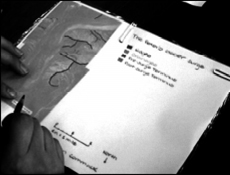
A student map of ridges,
drainages, and the pre-surge
terminus
|
|
Geographic
Content
Standard
A-1, 2, 3,
4, 5, 6
B -8
|
|
The instructor completes the mapping exercise on an
overhead projector while the students follow along.
- Start with the POST Surge aerial photo
first.
- Attach mylar with paper clips.
- Have each student make a scale on the mylar.
Using a ruler mark a 2" line and 1/4" increments on one
of the inches. Our scale is one inch equals one
mile.
- Have students make a key that designates the
colors of your choice to indicate Ridges, Drainages,
PRE Surge terminus and POST Surge
terminus
- Make sure to include a North Arrow (check on
the large topographic map to be sure of the correct
orientation!)
- Don't forget the title and to give
credit to the map maker. Write your name on the
map!
- Using the color designated in your key, trace the
drainages.
- Using the color designated in your key, trace the
ridges.
- Using the color designated in your key, trace the
POST Surge terminus.
- Remove the mylar from the POST surge aerial
photo
- Now use the ridges and drainages to key
in, or register, your mylar to the PRE Surge
aerial photo. This may take some turning of your map.
Clip in place when the mylar is satisfactorily
aligned.
- Using the color designated in your key, trace the
PRE Surge terminus.
- Remove your map from the aerial photo.
|
Math
Content
Standard
A - 1, 2, 3, 6
B - 3, 6, 8
Math
Performance
Standard
age 11- 14
Measurement
4
|
|
Math
Content
Standards
A - 2, 3
Math
Performance
Standards
age 11-14
Measurement
1,2,4,5
Estimate
and
Compute
age 11-14
3,4
|
Calculating the Surge
Rate
Next guide the group in calculating the surge rate of the
Peters Glacier. This is an excellent opportunity to discuss
the mathematical formula for a rate and determine what
information is needed for calculation: Rate =
Distance/Time
- To determine the distance the glacier traveled: using
a ruler measure on your map the distance in inches. This
will directly equate to miles using our scale of one inch
per mile.
- The time between the two photographs is 212
days.
- Divide the distance by time to get the rate in miles
per day.
- Guide the students to convert the answer into feet
per day (one mile = 5280 ft.)
- Compare the result with the estimated length in feet
of the classroom.
It's great to make a contest out of the map
project with prizes given for the most accurate, neat, and
complete maps!
|
Observing Snow
Introduction
The Four Corners of Life
Water: the Stuff that Makes Snowflakes
Snow on the Ground Changes Through Time
Exploring Native Snow Terms
Glacier Investigations
Open Note Review
Conclusion
Bibliography & Resources
|
 The
University of Alaska Fairbanks is an Affirmative
Action/Equal Opportunity employer, educational
institution, and provider is a part of the University of Alaska
system. Learn more about UA's notice of nondiscrimination. The
University of Alaska Fairbanks is an Affirmative
Action/Equal Opportunity employer, educational
institution, and provider is a part of the University of Alaska
system. Learn more about UA's notice of nondiscrimination.
Alaska Native Knowledge
Network
University of Alaska Fairbanks
PO Box 756730
Fairbanks AK 99775-6730
Phone (907) 474.1902
Fax (907) 474.1957 |
Questions or comments?
Contact ANKN |
|
Last
modified
August 17, 2006
|
|
|