|
Slide #1
|
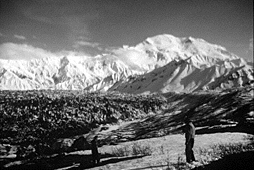
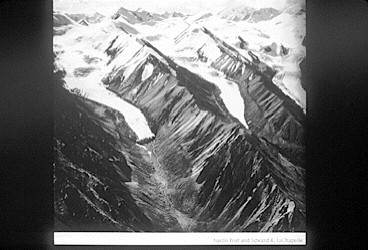
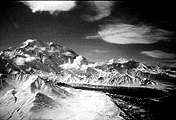
The Peter's Glacier is a good example of a mountain
glacier located in Denali National Park in interior
Alaska.
|
|
Slide #2
|
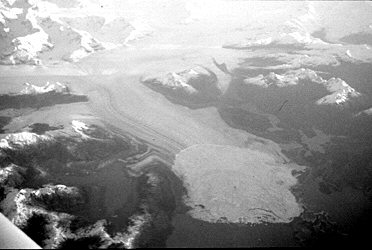
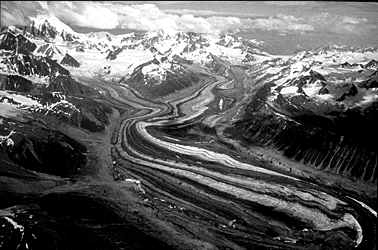
The Columbia Glacier is an excellent example of a tide
water glacier located in Prince William Sound, Alaska.
A tidewater glacier has a terminus in the ocean.
|
|
Slide #3
|
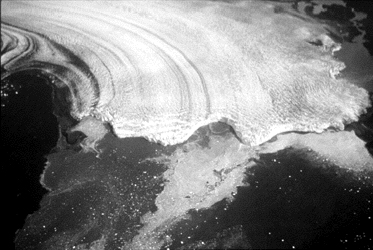
A close up of the Columbia's tidewater glacier terminus
in the ocean.
|
|
Slide #4
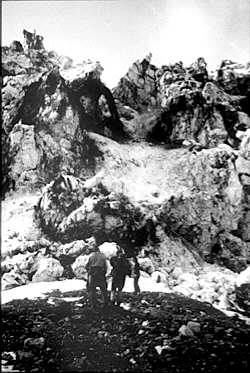
|
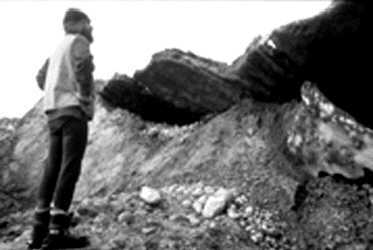
A hanging glacier terminus with a researcher standing
under the cliff-like terminus. Glaciers that are advancing rapidly
often have moraines with abrupt faces full of poorly
sorted glacial till that has been pushed forward
by the glacier.
|
|
Slide #5
|
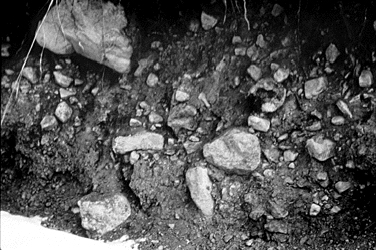
Glacial till. Poorly sorted rock material that
has been eroded and deposited by the movement of a glacier.
|
|
Slide #6
|
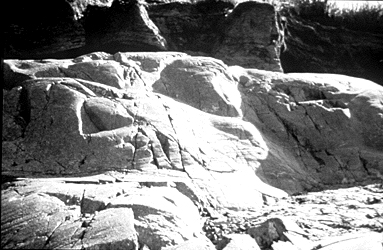
Bed rock smoothed and scratched by glacial movement. Lines,
striations, and scratches in the rock are created by the
abrasion of glacier movement. The resulting fine glacial
flour is produced much like sandpaper smoothing and
creating dust.
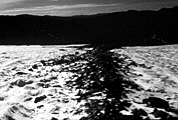
|
|
Slide #7
|
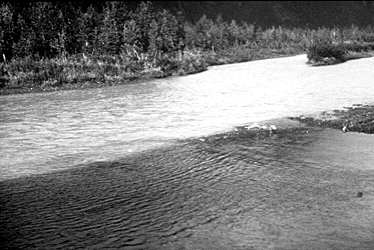
Two rivers merging: one river is clear and the other is
of glacial origin and laden with glacial silt. The
difference in river clarity is very evident.
|
|
Slide #8
|
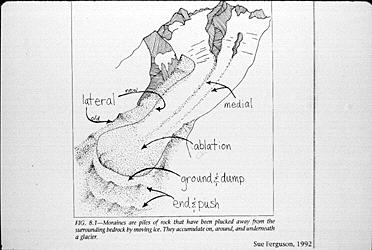
A diagram from, "Glaciers of North America" by
Sue Ferguson. It shows important glacial features.
- Identify and explain: Medial Moraine, Lateral Moraine,
Zone of Ablation
|
|
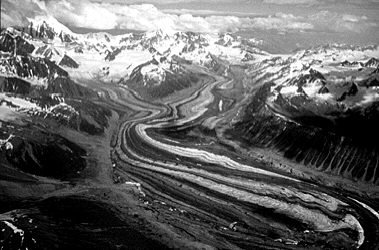
Slide #9
|
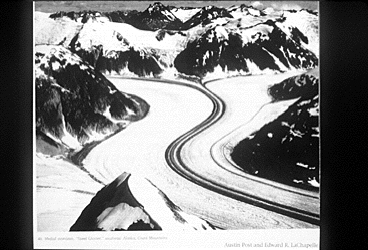
A Normal Mountain Glacier. This glacier flows at
a relatively normal rate of about 100 meters / year. The medial
moraines are parallel and regular.
|
|
Slide #10
|
The terminus of Susitna Glacier during the 1985 surge
event.
- Identify: Flowing water from under the glacier, Flowing
water along the sides of the glacier, Flowing water seeping
out of gravels, Folded moraines, Dirty terminus, Kettle
ponds in moraine.
- What phases of water can you see in this slide?
SOLID, LIQUID, & VAPOR. Clouds, glacial
ice, snow, ponds, and streams are all examples of
the many phases of water in the hydrologic cycle represented
in this photo.
|
|
Slide # 11
|
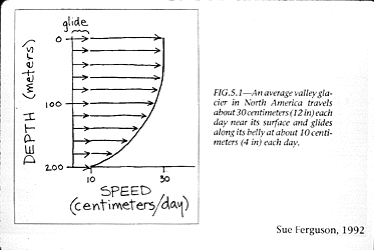
A diagram from "Glaciers of North America," by
Sue Ferguson. An average valley glacier in North America travels
about 30 cm (12 in.) each day near its surface and glides
along its belly at about 10 cm (4 in.) each day.
- Why would a glacier move more slowly at the bottom
than
the top?
FRICTION caused by valley bottom.
|
|
Slide # 12
|
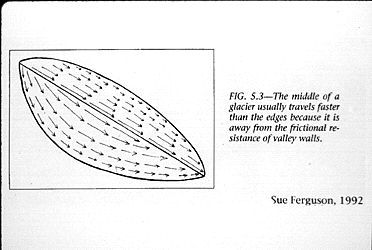
A diagram from "Glaciers of North America," by Sue Ferguson.
The middle of a glacier usually travels faster than the
edges due to FRICTION of the ice passing over rock.
|
|
Slide # 13
|
A medial moraine is created by the flow of ice
in different rates in different places. These differences
create currents or "waves" in the flow of the ice that
push up and deposit rock material. Those deposits located
in the center of a glacier or where two valley glaciers
merge are the medial moraines.
|
|
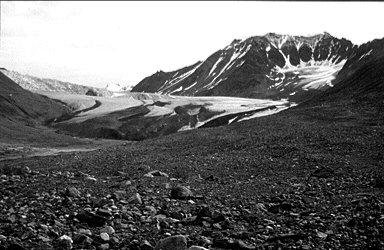
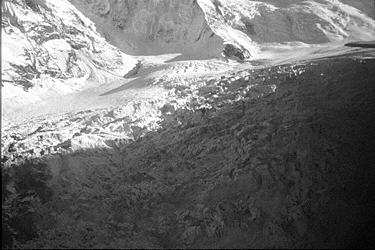
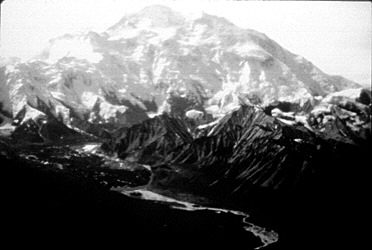
Slide # 14
|
The terminus of the Gulkana Glacier located east
of the Richardson Highway near Summit Lake.
The Gulkana is a retreating glacier, note the zone of ablation at
end of glacier where rock and dirt have been deposited.
|
|
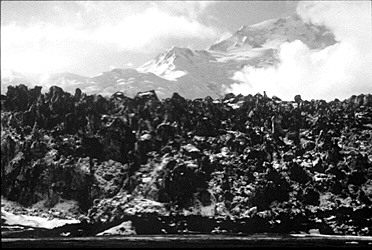
Slide # 15
|
An Ice Fall on the Peter's Glacier. The ice flows
over such steep terrain that it acts like a frozen water
fall. The ice moves so quickly that it breaks rather than
flowing by deformation. This is a good example of Brittle
Deformation.
- What kind of deformation do surging glaciers experience
during a surge? Brittle.
|
|
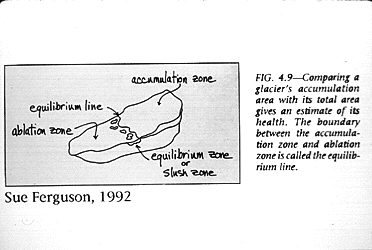
Slide # 16
|
A diagram from "Glaciers of North America," by Sue Ferguson.
Comparing a glacier's accumulation area with its
total area gives an estimate of its health. The boundary
between the accumulation zone and ablation zone is
called the equilibrium line.
|
|
Slide # 17
|
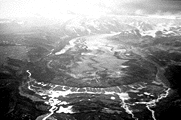
A black and white photo of two glaciers side by side in
two adjacent valleys.
· Which glacier is advancing?
The glacier on the left is advancing. Note that the terminus is
more "bulbus". The glacier on the right is retreating.
Note that it looks deflated.
|
|
Slide # 18
|
The Surging Susitna Glacier. Some distinctive features
of a surging glacier are looped moraines.
- Compared to a normal glacier, what is different about
this glacier that causes its moraines to occur in such
interesting patterns? There is a reduced amount of friction
where the glacier contacts the valley bottom and sides.
This lubrication causes the ice flow rate to accelerate
dramatically.
|
|
Slide # 19
|
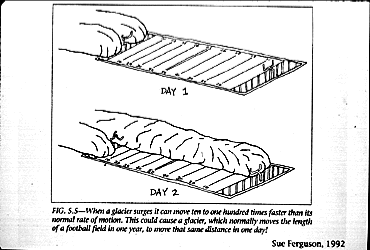
A diagram from "Glaciers of North America," by Sue Ferguson.
When a glacier surges it can move ten to one hundred
times faster than its normal rate of motion. This could
cause a glacier, which normally moves the length of a football
field in one year, to move the same distance in one day.
|
|
Slide # 20
|
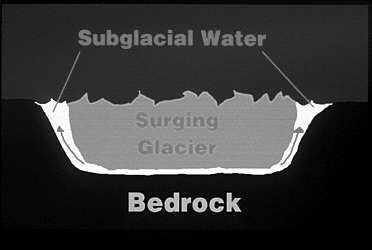
A color diagram illustrating the cross section of a surging
glacier positioned on top of a layer of subglacial
water in bedrock. A glacier surges because it's plumbing
becomes clogged. Water becomes trapped under the glacier
reducing friction and causing sudden, rapid advances.
Glaciers surge in cycles. Surging glaciers in the Alaska
Range are estimated to surge every 50-75 years. Note lateral and medial
moraines, parallel to valley walls.
|
|
Slide # 21
|
The bathtub photo. Once the glacier surges, mass
moves down valley. The bathtub ring shows what the surface
elevation of the glacier was prior to the surge in the
upper portions of the glacier.
|
|
Slide # 22
|
The Susitna Glacier located off the Denali Highway in
interior Alaska.
· Is this a surging glacier? Yes
· How can you tell? Looped, or contorted moraines.
|
|
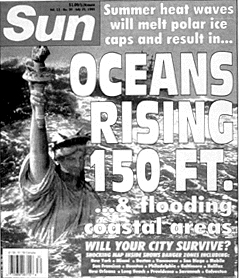
Slide # 23
|
A news paper tabloid with the headlines, "Ocean Rising
150 Ft." along with a picture of the Statue of Liberty
chest deep in water. An article follows the headlines, "Summer
Heat Wave Will Melt Polar Ice Caps and Result in Ocean
Rising 150 Ft. and Flooding Coastal Areas. Will your City
Survive?"
· Why do we study glaciers? To
understand long - term climate trends.
|
|
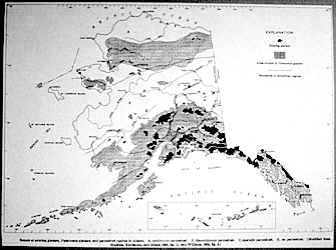
Slide # 24
|
A map of the extent of glaciation during the most recent
episodic ice age events that dated from 160,000 to 15,000
years ago. Note regions which were covered by glaciers
during the last ice age and areas that are currently covered
in glaciers.
|
|
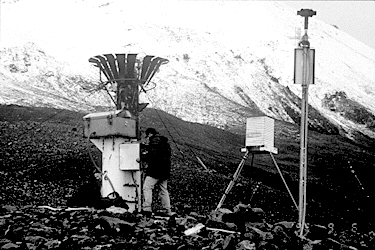
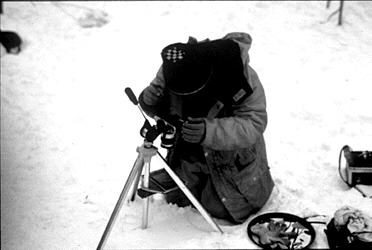
Slide # 25
|
This photo consists of three main instruments used to
collect data from a glacier. The antenna is part of a satellite
telemetry system which transmits data back to researchers
at the Geophysical Institute Fairbanks, Alaska, via satellite.
The anometer on top of the pole measures wind speed, and
the wooden box on the stand contains a temperature sensor.
There is a slit opening in front of the box which allows
the sun to strike the sensor only once a day causing a
temperature reading to rise for a short time. Researchers "calibrate" their
electronic clock in the more modern data collection system
using the daily temperature spike.
|
|
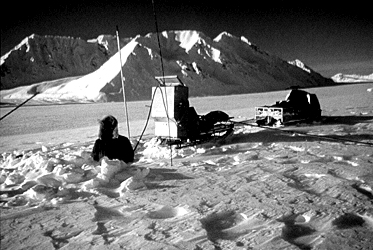
Slide # 26
|
Researchers use snowmachines to travel to where they can
study glaciers. Two researchers are out on an ice field
as the snow machine pulls a sled loaded with equipment.
|
|
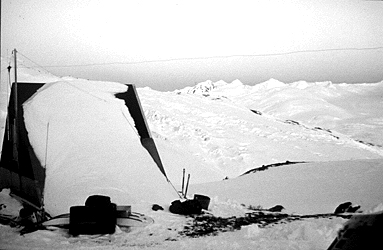
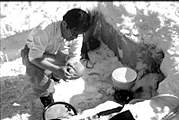
Slide # 27
|
A Geology research camp with equipment outside a shelter.
|
|
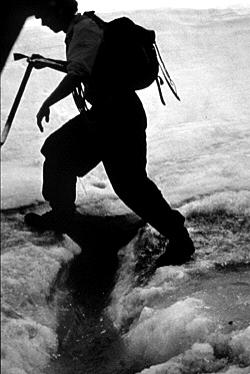
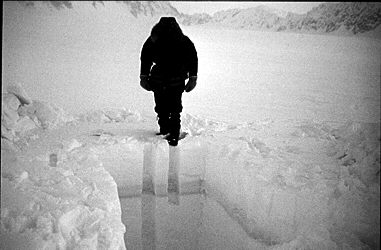
Slide # 28
|
A researcher (woman) walking on a glacier, stepping over
a crevasse. She is holding an ice axe and carrying a backpack.
This photo highlights the dangers associated with work
on a glacier and the need for good equipment and special
training prior to going out in the field. Always use caution
when out on glaciers!
|
|
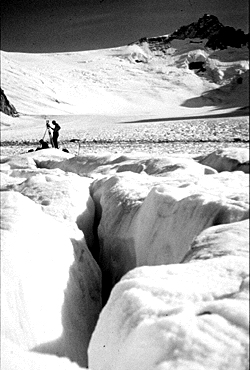
Slide # 29
|
A crevasse on a glacier with researchers and equipment
in the background. The researcher appears to be surveying
in the background. Periodic surveys determine a glacier's
net accumulation of snow, and help determine the overall
water budget for a given watershed.
|
|

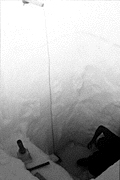
Slide # 30
|
An exposed wall with a person standing nearby observing
the snow profile visible in the wall.
|
|
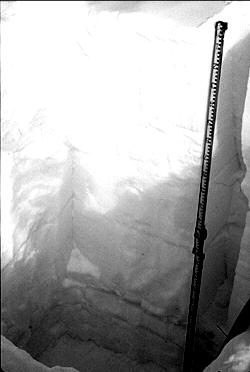
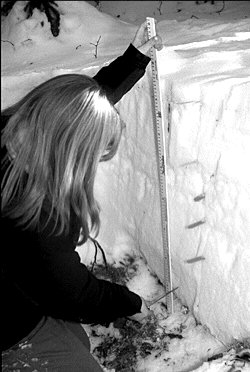
Slide # 31
|
A deep snow pit dug into a glacier. A researcher is looking
down into the snow pit. The different layers are visible.
There is a small trench cut into the side of the snow pit
where researchers have collected snow density data
using a snow density sampling box. This is the same
instrument we use in our Snow Pit Activity to take
samples to determine snow density.
|
|
Slide # 32
|
A close up of the snow pit with the researcher down at
the bottom of the deep pit using a snow density sampling
box.
|
|
Slide # 33
|
Close up of the inside of the snow pit with a meter stick
measuring the height of each layer. You can also see the
thermometer dials in the lower left of the photo.
|
|
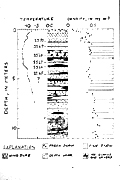
Slide # 34
|
A sketch of the glaciologists' snow pit profile. The sketch
includes the height, density, and temperature of
each layer. In addition, each layer is coded as to the
type of snow present in the layer. Snow types they have
observed include: wind slab, fine snow, fresh snow, depth
hoar, and ice layers. We will record the snow layer
we encounter in the Snow Pit Activity.
|
|
Slide # 35
|
A McGrath student taking temperature measurements in a snow
pit. The colored sticks are the tongue depressors,
where the different snow layers have been identified
and marked.
|
|
Slide # 36
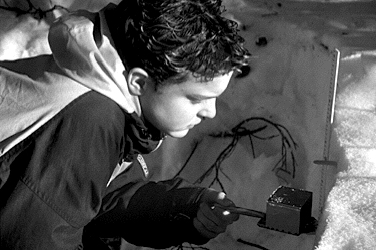
|
A McGrath student using the density sampling box,
a tool that samples precisely 2003cm of snow. The sample
is then weighed. The information is used to calculate the density,
or percentage of water, of the snow layer.
|
|
Slide # 37
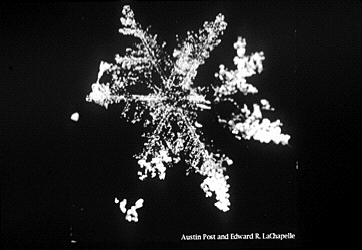
|
A close up photo of a stellar snow crystal by Edward
LaChapelle.
|
|
Slide # 38
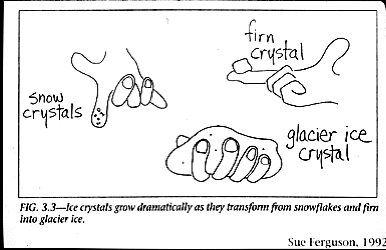
|
A diagram from "Glaciers of North America," by Sue Ferguson.
Through the processes of Destructive Metamorphism, Pressure and
the Melt Freeze cycle, delicate snow crystals are
transformed into rounded ice grains. Through time, they sinter together
to form larger and larger ice crystals, eventually
becoming glacier ice. Ice crystals grow dramatically
as they transform from snowflakes to firn, and ultimately
into glacial ice.
|
|
Slide # 39
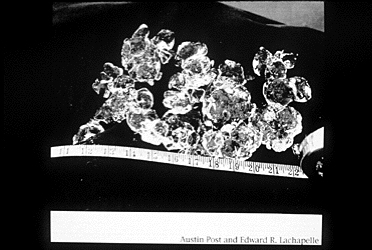
|
A photo of glacier ice crystals. The measuring
tape reads inches.
· How big is the largest crystal?
|
|
Slide # 40
|
A close up of a researcher down in a snow pit examining glacier
ice crystals.
|
|
Slide # 41
|
A close up of the same researcher photographing glacier
ice crystals.
|
|

Slide # 42
|
A close up of ink dyed glacier ice crystals.
- Why do you think the spots (air bubbles) are oval shaped?
Pressure from the ice mass and its movement. The long
axis of the bubbles are perpendicular to direction of
greatest force.
|
|
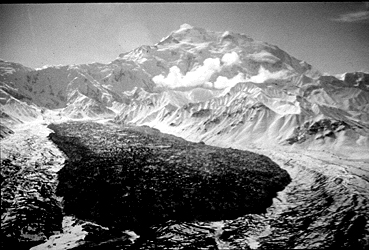
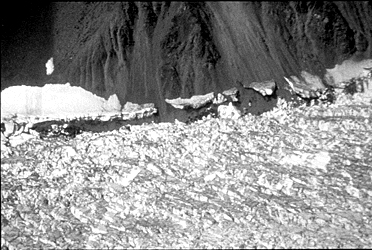
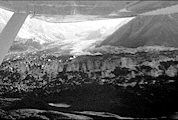
Slide # 43
|
A photo looking down on the margin of the Peters Glacier during
the initial phases of a surge. Ice is part of the glacier
surface, the black rock is the valley wall, and the gray
is water.
- Why is the water gray? Contains silt
- Why would the water contain silt? Source is the bottom
of the glacier.
|
|
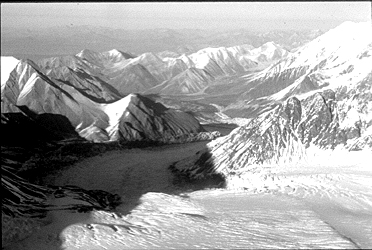
Slide # 44
|
Looking down the Peter's Glacier.
|
|
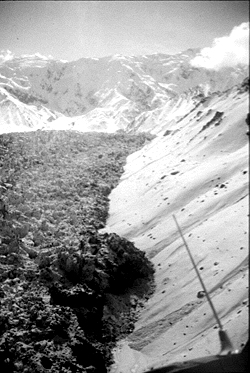
Slide # 45
|
The edge of the Peter's Glacier during surge.
- By looking at the ice, can you tell if deformation
was brittle or ductile? Yes, brittle.
|
|
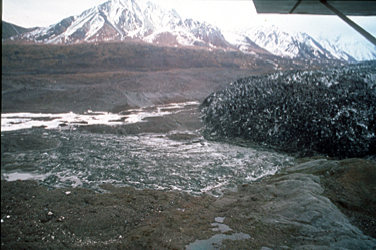
Slide # 46
|
A close up of the Peter's Glacier terminus.
|
|
Slide # 47
|
A close up of the Peter's Glacier terminus.
|
|
Slide # 48
|
A view from an airplane of the Peter's Glacier.
|
|
Slide # 49
|
Researchers building rock karins in 100' intervals in
front of the Peters Glacier during the surge.
They retreat to a safe place and time how long it takes
for the surging glacier to run over the regularly
placed rock karins. From the information gathered the rate of
the surging glacier can be determined.
Rate = Distance/Time.
|
|
Slide # 50
|
The first of the series: Peter's Glacier PRE-SURGE,
a red line indicates the terminus.
|
|

Slide # 51
|
The second of the series: Peter's Glacier, POST - SURGE,
the red line indicates the terminus.
|
|
Slide # 52
|
The third of the series: The Peter's Glacier POST -
SURGE, a different view.
|