|
HOW WELL ARE INDIAN
CHILDREN EDUCATED?
Chapter Three
DIFFERENCES IN STUDENT
BACKGROUNDS
A great many statements have
been made and articles written describing the Indian student,
often drawing comparisons between him and white
pupils. Good or poor achievement has frequently been explained
on the basis of racial or cultural differences between the two
groups. Up to the time of this study, no service-wide survey
has collected the data needed to draw valid conclusions in regard
to:
1) the actual difference between the achievement of Indian students
and white children from rural areas,
2) cultural differences between the two groups, or
3) the relation between achievement and cultural differences.
It may be said therefore that the objective of this survey is
three-fold:
1) to measure the educational achievement of students in Indian
schools,
2) to gather data relative to the cultural backgrounds of the
Indian and non-urban white students in Indian, public and mission
schools,
and
3) to determine the relationships, if any, which exist between
these measures of cultural background and school achievement.
Practical limitations made it necessary to collect cultural data
on a relatively small number of topics, but those which were
selected for study were those which seemed likely to be most
important as
an aid to interpreting the test data and also as indication of
the other information which should ultimately be collected during
the following years of the study.
Cultural Backgrounds of the Students
Table III-1 describes the degree of Indian blood of the students
in the three grade levels in the different types of schools and
in the different geographic areas. All of the entries in this
table are in terms of percentages. It has been broken down into
many
categories, and therefore it must be remembered that some of
the entries represent only a very small number of cases.
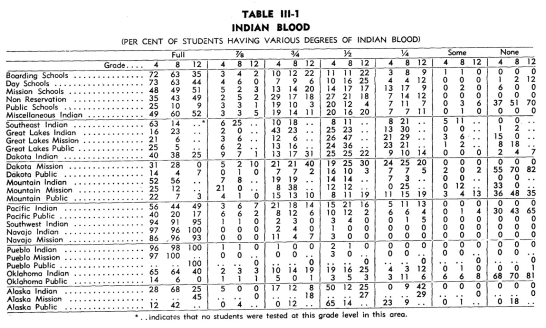
Some generalizations which can be drawn from this table are:
1) Nearly all of the students in the Navajo, Pueblo and other Southwest
schools are full-blood Indians.
2) There is a larger percentage of mixed-blood students in the
non-reservation schools than in any of the other types of Federal
Indian schools.
3) The public schools and mission schools selected for comparison
have a fairly wide range of students, extending from the full-blood
Indians to all-white students.
4) In view of the fact that the some criteria were used in the
selection of the fourth, eighth and twelfth grade public school
students, it is significant that there is considerable difference
in the percentage of non-Indians, i.e., white students at the three
grade levels, the fourth grade having 37% white students, the eighth
grade 51%, and the twelfth grade 70%. This would indicate that
there is a dropping out of Indian students in public schools in
the higher grades. Differences this great cannot be ascribed to
differences in total Indian population in these age brackets, for
the Bureau of the Census reports that 11.9% of the Indian population
falls in the age group 10-14 years, and 10.8% in the group from
15-19 years, as compared to percentages for native whites in the
same groups of 9.6% and 9.1%. The data therefore suggest the possibility
that the holding power of the public schools is greater for white
students than for Indian students.
In interpreting the tables and charts, it is necessary to keep
in mind that these data describe three separate groups of students
instead of the same students at three periods. Because of the large
number of older students who withdrew, both from Indian schools
and from public schools, during the war to enter the armed forces
and war work, all interpretations relative to differences between
students at the various grade levels are extremely tentative.
The data do not justify a conclusion that school success is limited
by the degree of Indian blood. It is true that relatively low achievement
is found in some of the areas where the percentage of full-blood
students is relatively high. On the other hand, in Oklahoma, where
65% of the fourth grade Indian School students are full-bloods,
the achievement is considerably higher on the various tests than
in Dakota, where there are fewer full-blood Indian students.
Another observation which can be made from this table indicating
the degree of Indian blood of the various students, is the tendency
for the higher grade levels to have a lower percentage of full-blood
Indian students than the lower grade levels. This would indicate
that the dropout has probably been higher among full-blood Indian
students.
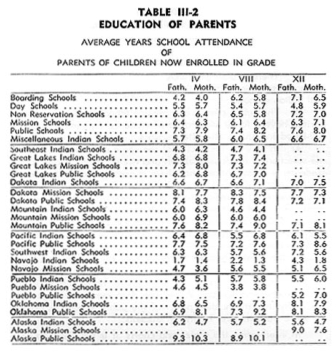
The relation between the tendency to stay in school and the background
of the students can also be observed in Table III-2, which describes
the education of the parents of the students tested.
This table indicates a greater number of years of school attendance
by the parents of students in the upper grades. In other words,
students coming from homes in which the parents have had the advantage
of considerable
education, tend to remain in school longer than those coming from
homes where the parents have had little or no schooling. This is
even more significant
when one realizes that the parents of students eligible for the twelfth grade
normally belong to an older and less literate generation than do the parents
of the students eligible for the fourth or eighth grades. The report
of the Bureau of the Census
indicates that the Indian literacy has increased from 44% for
all Indians over 20 years of age in 1910, to 74.8% for all Indians
over 25 years of age in 1940.
For the mission and public schools, there is little or no difference
between the educational attainment of the fathers and mothers of
the children at the various grade levels, whereas in the Indian
schools the difference is quite noticeable. The number of years
of school attendance of the parents of the public school children
is, on the whole, higher than that of any of the other parent groups.
The educational level of the Indian parents in the Navajo area
is considerably below the level of parents in any of the other
regions, and it is also in this area that the students' achievement
is considerably below that of other areas.
In those areas in which pupils in public schools show superior
performance to the pupils in Federal Indian Schools, it will be
found that the educational attainment of the fathers and mothers
of those public school students is considerably higher than that
of the parents of the students in Indian schools located in the
same area. In areas in which the Indian students did as well or
better, than the public school students, such as in the Great Lakes
or Oklahoma areas, there is relatively little difference between
the educational attainment of the parents of the two groups. Table
III-2 shows that the number of years of schooling for the parents
varies greatly in different regions.
Data were collected on the number of generations known to have
taken advantage of educational opportunities. The data collected
were based only upon that information which students were able
to furnish. These data seemed to show trends similar to those already
observed by studying the data relative to the number of years of
schooling of the parents. Since the data concerning the education
of the parents is probably more reliable than that which pertains
to the education of the grandparents, nothing significant would
have been added by including the statistics relative to the latter.
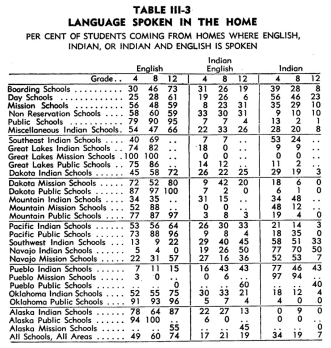
Table III-3 describes the language reportedly spoken in the homes
of the fourth, eighth and twelfth grade students, according to
the 1946 study. It should be noted that this represents the language
which the student reported as that which is actually, habitually
spoken in the home--not the homes in which one
or both parents can talk and understand enough English to converse
in that language
if necessary. There is evidence that many students who, because
they speak English around school and are thought of as English-speaking,
actually speak only Indian when they are at home. It is also
apparent that
many adult Indians who speak perfectly good English when necessary,
elect to converse in their Indian language at home. It will be
noted
that the students in day schools come from homes in which less
English is spoken than do the students in any of the other types
of Indian schools. As would be expected, the public school children
have by far the greatest amount of English spoken in their homes.
This is true for Indian students in public schools, as well as
for whites in public schools. A
much greater proportion of English is spoken in the homes of the
twelfth grade students in Indian schools, and the proportion for
the eighth grade
is greater than that for the fourth grade. The language spoken
in the home appears to be correlated with school achievement and
also with the number of years the student remains in school.
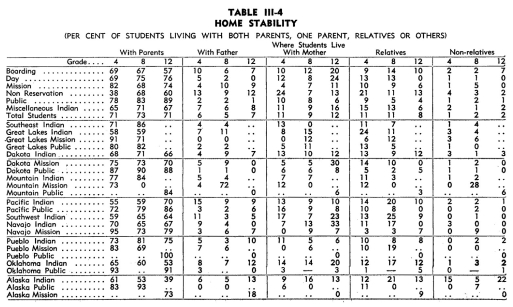
The factor of home stability was studied because it has often been
claimed that broken homes may contribute to poor pupil achievement.
Table III-4 describes the home stability of the students by indicating
the percentage living with their parents, with only their father,
with only their mother, with relatives, or with non-relatives.
These data do not appear to have a direct or easily interpretable
relationship with any of the achievement scores, or with home
factors studied, but they
will probably prove of value and interest in personnel and- adjustment
studies. For example, the percentage of students living with
both parents is much smaller among students in non-reservation
boarding schools than in any other type of school;* yet the achievement
among non-reservation students was relatively high. The number
of students living with
both parents on the Navajo and Pueblo reservations is higher than
is the case either in the Dakotas or in Oklahoma; yet the Navajo
and Pueblo achievement was, in most cases, low and that in the
Dakotas and
in Oklahoma high. The data do not indicate, of course, that the
broken home is never a factor in the poor achievement of an individual
student, but they do indicate that, whatever the adverse effects
of a broken home may have been among these students, they are concealed
by other factors more directly affecting achievement.
* Dependency because of a broken home is one criterion for admission
to a non-reservation boarding school.
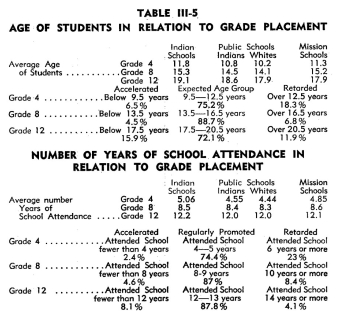
Table
III-5 shows the age distribution of the students in each of the
grades and types of schools studied, and the number of years
each of the students has attended school. One of the first observations
one makes from the table is that those students who are retarded
either from the standpoint of chronological age, or in the number
of years they have attended school, tend to drop out of school
before the completion of the eighth grade. At the fourth grade
level 23% of all the students have been in school six or more years.
Assuming no additional retardation, this group is comparable to
those of the eighth grade level who have attended ten years or
more, and at the twelfth grade level who hove attended fourteen
years
or more. Yet, at the eighth grade
level only 8% of the students, and of the twelfth grade level only
4% of the students, fall into this group. This decrease in the
percentage
of retarded students in upper grades could also be explained by
an acceleration during the interval or because more of the students
now entering have difficulties that result in early retardation.
Many students with low achievement have had it attributed to
the fact that circumstances have made it necessary for them to
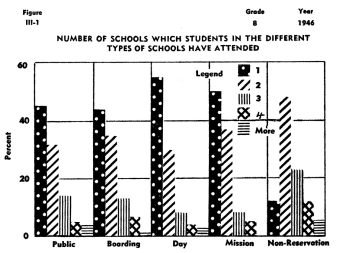
transfer many times from one school to another.
The information in Figure III-1 was collected on the eighth grade
students in 1945. In the
non-reservation schools, where achievement has been found to be
relatively high, most of the students have attended more than one
school. There appears to be no direct relationship between poor
achievement and frequent transfers from one school to another.
Relationships Between Measures of Cultural Background and School
Achievement
Figures Ill-2, 3, 4, and 5 summarize o segment of the cultural
background information collected, showing not only a wide variation
between the backgrounds of the students, but also a relationship
between several of these factors and school achievement.
The first four columns in Figures III-2 and 3 show the relationship
between the number of schools the student has attended and achievement
in arithmetic computation. In the case of the fourth grade, pictured
in Figure III-2, the achievement of the students in arithmetic
computation is lowest for students who have attended only one school.
While the differences are not large, the fact that achievement
is higher for students who have transferred gives some assurance
that the transferred student is not handicapped in his arithmetic
computation achievement by the number of times he has transferred.
It may be, of course, that students who transfer have certain other
qualifications which, in turn, are understandably related to success
in school. This may be a case in which the transfer itself is not
the cause of high achievement, but is only indicative of the fact
that a highly select group of students is forced to transfer. Some
might wish to read into this the added possibility that increased
effort on the part of both the pupil and the teacher results from
school transfer, thus resulting in higher achievement.
The relation of school transfer to twelfth grade achievement in
arithmetic computation is shown in Figure III-3, and to Part D
of the Gates Basic Reading test in Figure III-4. At the twelfth
grade level a larger percentage of students have experienced transfer,
but this is to be expected because by the time students have reached
the twelfth grade, most will have been forced to transfer of least
once or twice. The differences between the achievement of students
who have attended one school only, and that of students who have
attended several schools, is so small that it may have occurred
by chance. This fact bears out the observation concerning the analysis
in relation to achievement in arithmetic computation at the fourth
grade level, namely that there is little or no evidence that transfer
is a serious handicap to achievement in school.
Columns 5, 6 and 7 of Figure III-2 compare the regularity of attendance
of fourth grade students with achievement in arithmetic. As one
would expect, the higher achievement is made by students with
regular attendance and, with the exception of those who have been
out of school more than one year, the median achievement is lower
for those whose attendance has been irregular. It would appear
that the maturation of students who have been out of school one
or more
years tends to offset low achievement in arithmetic. At the fourth
grade level, the number of students who have been out of school
more than one year is so small as to make this sample less reliable
than for
the other groups studied. Referring to Figures III-3, and III-4,
it will be noted that the differences in achievement in arithmetic
computation, for students who have had different patterns of
regularity of school attendance,
are smaller than is true for their achievement on the Gates Basic
Reading Test, Type D. This would seem to indicate that a student's
out-of-school experiences ore less likely to compensate for his
lock of instruction in reading than in arithmetic computation.
The seemingly significant and more understandable differences are
those between the students who have attended school regularly and
those whose attendance has been irregular. The relatively high
achievement in arithmetic computation by upper grade students who
have been out of school more than one year might be explained through
the effect of training received in the armed forces, since a considerable
number of veterans were included in this group.
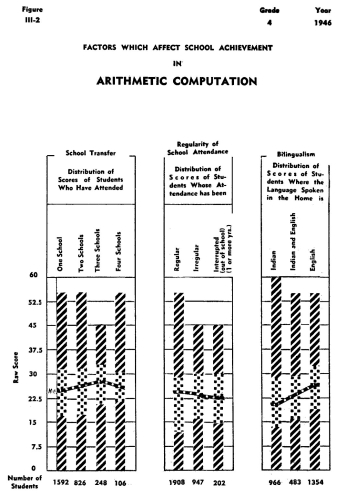
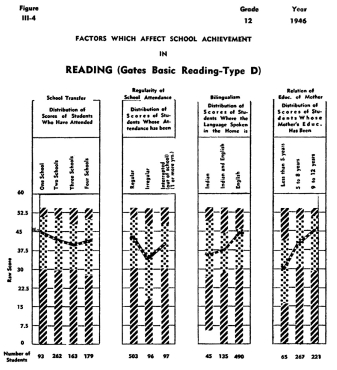
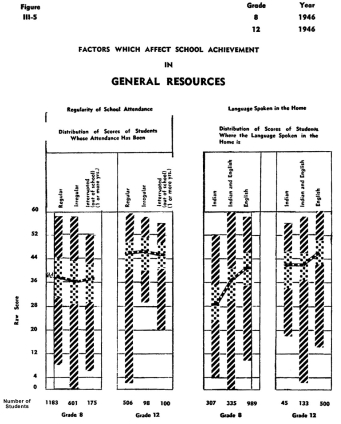
Figure III-5 shows the regularity of attendance for the eighth
and twelfth grade students and its relation to achievement on
the General Resources test. Here again, some of the same observations
can be made, and in the case of the twelfth grade pupils, it
would appear that somewhat irregular attendance does not seem
to hamper the students' achievement, and may even be associated
with whatever factors provide a beneficial effect. In most instances
the differences are not large, and may even have occurred by
chance, particularly in the cases where there are few students
in the group. In a subject such as General Resources, where regularity
of school attendance does not appear to contribute to high achievement,
it might be interpreted that the material represented by the
test was not actually being taught in the school.
Figures III-2, 3, 4, and 5, also show the relationship between
the language spoken in the home and school achievement in arithmetic,
General Resources, and Gates Basic Reading, Part D. Quite consistently,
students coming from homes where only English is spoken showed
higher achievement than those students coming from homes where
only Indian is spoken. Moreover there is seemingly little or no
difference between the achievement of those students from homes
in which only Indian is spoken and those in which both Indian and
English are spoken. It will be interesting to many to observe from
these figures that the fact that a student comes from a home in
which only Indian is spoken apparently does not place a ceiling
on his achievement, because there is a significantly large number
of students coming from homes where only Indian is spoken who do
better, even in the Reading test, than the average student coming
from a home in which only English is spoken. Therefore, failure
to use English in the home is not so great a handicap but that
it may be counterbalanced by many other factors of equal or greater
significance. It should not be overlooked, however, that coming
from a home in which little or no English is spoken is undoubtedly
a handicap to the student who receives his training in o school
where the development of a meaningful English vocabulary is not
given special consideration.
The last two columns of Figures III-3 and III-4 show the relation
between the educational attainment of the mothers of the students
and the students' achievement in arithmetic computation and reading.
Distributions of scores according to school grades completed by
the students' fathers show a pattern almost identical with these
patterns. It is interesting that the central tendency for both
tests increases with an increase in school grade completed by the
parents. However, more than one-quarter of the students whose parents
had completed nine or more years in school made scores below the
median of the students whose parents had attended school less than
five years. It is possible for other factors to counterbalance
or conceal the influence of lack of educational attainment by the
parents. On the other hand, it would appear that the educational
attainment of the parents, or factors associated with it, has a
favorable influence upon the students' achievement in both the
arithmetic computation and the reading tests.
Indian Students in Public Schools
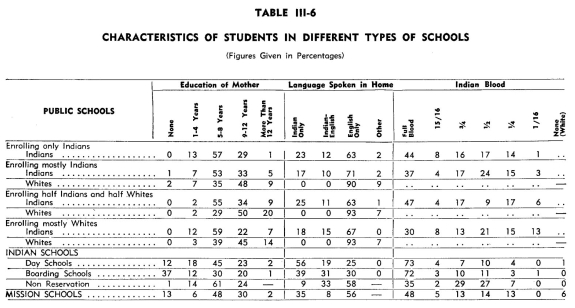
Table III-6 presents data which indicate that many of the Indian
children enrolled in public schools have a cultural background
more favorable to achievement in school than that of Indian children
enrolled in Federal Indian Schools. At the fourth grade level,
the parents of all Indian children in public schools had some formal
education whereas 37% of the mothers of students enrolled in Federal
boarding schools had never attended school. English is the only
language spoken in the homes of approximately 65% of the Indians
enrolled in public schools, as compared with 25% for students in
Indian day schools, 30% for Indian boarding schools, and 58% for
non-reservation boarding schools.
Because factors associated with white culture (the education of
the parents, the language spoken in the home, etc.) appear to affect
achievement favorably, one would predict that the achievement for
Indian students in public schools enrolling mostly white students
would be higher than that of Indian students in public schools
where few or no white students are enrolled. The opposite appears
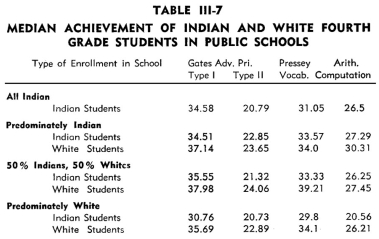
to be the case. Table III-7 shows the median achievement of Indian
and white, fourth grade, public school students in schools where
the enrollment is 1) 100% Indian, 2) predominately Indian, 3) 50%
Indian, and 4) predominately white. On three of the standardized
tests, the achievement of the Indian students in schools which
are predominately white is lower than that of Indians in any of
the public schools where fifty per cent or more of the students
are Indian. This unexpectedly poor achievement of Indians in predominately
white public schools may result from any one of o number of conditions.
It is possible, of course, that other factors, not measured in
this study offset the favorable effects of those factors which
have been named plus the apparently beneficial contact with white
students. It may be true that bilingualism is given less attention
in schools where the number of Indian students is small, and in
this case these students would demonstrate low achievement. Whatever
the contributing factors, there is no evidence that attendance
in o school where there are fewer Indian than white students, favorably
affects the school achievement of the Indian student.
Differences Between Interests of the Students
In addition to gathering data about the parents, home background,
and frequency of school attendance, information was sought relative
to the expressed interests of the students in the in-school and
out-of-school activities. Table III-8 describes the degree to which
various school subjects were preferred by the students tested in
the 1946 study. The extremely high percentage of students indicating
strong preferences for such academic subjects as English, mathematics
and social science in 1945, raised the suspicion that perhaps the
free-response type of questionnaire then used had biased the responses
and caused the students to list as their first choices those
subjects which they
had either just been studying or those which they felt their teachers
might prefer them to mention. In an effort to correct this possible
bias, the 1946 study listed both academic and vocational subjects
alphabetically. The preference indicated by students at the fourth,
eighth and twelfth
grade levels reflected the same type of preference for the academic
subjects as the students showed the previous year. Also there
appears to be relatively little difference between the preferences
of boys and girls. Even the grade level differences are not great
except in such subjects as art, where there is marked loss of
interest at the higher grade
levels.There is greater variety in the reading interest patterns
than in the case of school subjects preferred. In general, these
interest patterns showed remarkable uniformity between types of
schools. There was a marked similarity between interests of both
boys and girls, except in the case of cowboy stories and fiction.
Public school students appear to be more interested in mystery
stories than are the students in Indian schools, and less interested
in current affairs than students in Indian
schools. Students in all types of schools showed a high degree
of interest in comic books at the fourth grade level, with this
interest declining by the time the student hod reached the twelfth
grade.
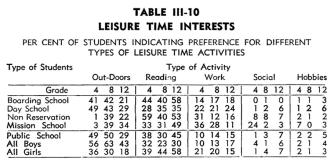
The tabulated results of the multiple choice leisure time interest questionnaire
of the 1946 study are given in Table III-10. There is a surprisingly high percentage
of students in all types of schools claiming interest in work activities.
The two areas, hobbies and social activities, attracted
the preference of only an extremely small number of students. It must be remembered
that these were the preferences expressed by students and that there was no
measure of the possible influence of responding, in a school situation, to
the type of activity which the student believed was the desired response.
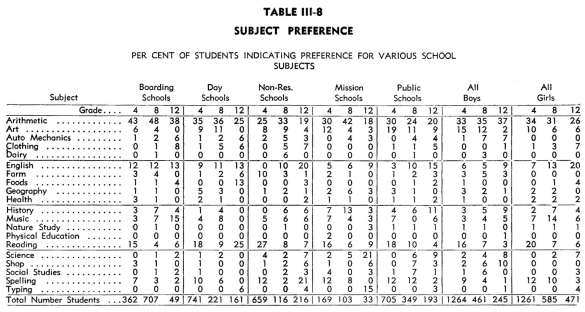
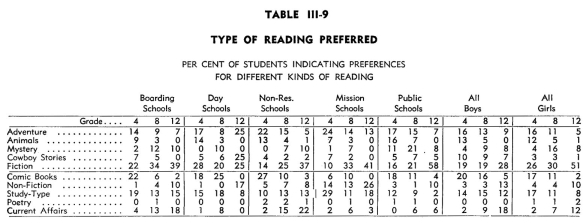
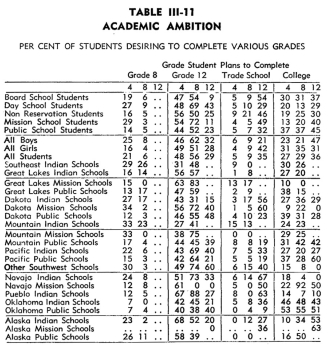
Table III-11 indicates the percent of students of each of the grade levels
tested who expressed o desire to complete eighth grade, senior high school,
trade school, or college. Less than one percent of the fourth grade students
indicated the intention of withdrawing from elementary school before the completion
of eighth grade. Ninety-four percent of the eighth grade students indicated
their intention of completing twelve or more grades. The data concerning present
enrollment suggest the probability that o much smaller per cent of the students
actually complete eighth grade, twelfth grade, or continue beyond high school,
than expressed the intention of doing so. More than three-fourths of the
students in fourth grade indicated their intentions of continuing through
the twelfth
grade, or beyond high school. Present enrollments
indicate that approximately one-fifth of the students actually
do remain in school this long. The fact that the present study
was conducted during the years of the war, when many students
withdrew to enter military service
or war-time employment, makes it impossible to predict the actual
number of students who would otherwise carry out their plans.
The number of students, even at the twelfth grade level, who indicated
their intention of completing college, is surprisingly large. Though
it is possible, particularly at the lower grade levels, that some
students may fail to differentiate between trade school training
and college, the number is so large as to suggest that many do
not recognize that they may not possess the capacity or the tools
necessary
to succeed in college. This observation is borne out by an analysis
of the reading ability of the students in relation to the educational
goal which each indicated. It was discovered that the range of
reading ability of twelfth grade students who did not plan to continue
their education was very similar to that of students who indicated
their intention of going to college. Among the twelfth grade students
indicating their intention of going to college, some of the students
made scores on the Gates
Reading Test, Part A, as low as 7 (Grade Equivalent 3.4). Though
it is possible that the fact that the test was not sufficiently
difficult for some of the best twelfth grade students may have
lowered slightly the median scores, it would appear that the median
score of 19.0 (Grade Equivalent 6.7), as compared with a median
score of 16.6 (Grade Equivalent 6.0) for those who did not intend
to continue beyond the twelfth grade, indicates that many intend
to go to college who do not have the reading skill necessary for
successful achievement in even an academic program in the senior
high school. Though the test may not have measured fully the achievement
of the best students, it was undoubtedly adequate to measure the
reading ability of the majority of the students.
|