|
HOW WELL ARE INDIAN
CHILDREN EDUCATED?
Chapter Four
RESULTS ON STANDARDIZED
TESTS
Two types of tests were used in both
1945 and 1946. The data from the standardized examinations will
be discussed in this chapter.
Chapter 5 will analyze the data from the tests constructed especially
for the Indian Education Evaluation Program.
Most of the graphs presented in this monograph are copies of the
eighth grade norm sheets prepared for the 1945 study, upon which
have been indicated the medians for the fourth and twelfth grade
students, who took the same tests in 1946. Only part of the original
norm sheets have been duplicated in this monograph, but the medians
and quartiles computed for all distributions and all tests are
given in Tables 1 and 2, Appendix F.
Attention should be drawn to several things in studying the norm
sheets. It will be noted from the numbers at the bottom of each
graph, that some distributions are based upon a large number of
cases whereas others are based upon only a few. In those instances
in which there were only a few cases one must be cautious in drawing
conclusions because the various statistics, such as median, quartiles
and the like, cannot be interpreted as possessing the same degree
of accuracy as those statistics based upon, larger samples. For
example, fewer than 30 cases are used as a basis for the data describing
the eighth grade Indian students in the Pacific area. This means
that, though the median truly represents the mid-score or central
tendency for this particular group of students, it cannot be depended
upon as a highly accurate estimate of the kind of work that should
be predicted of all eighth grade Indian students in the Pacific
area. In most instances data were obtained from all of the fourth,
eighth, of twelfth grade students enrolled in Indian schools. The
charts therefore describe the actual status and performance in
the schools in each area. It should be borne in mind that the size
of the group tested determines the accuracy of predictions. These
norms and distributions are intended to present a picture of the
level of work being done by students in these different regions
and types of schools. Their representativeness and accuracy are
indicated by the figures which show the number of students tested.
The number of students in a particular group or region may in itself
be indicative of the uniqueness of the group. For example, a small
number of students in Federal Indian schools in a particular region
may indicate that Indian schools provide only for a particular
type of student.
In the left-hand margin of each norm sheet a space was left in
which the school might inscribe its own distribution of scores.
The distributions are broken into four parts or quarters, each
one representing the range of scores for one-fourth of the class
or group. It will be observed that these distributions thereby
have parts which may be described as lower or first quarter, second
quarter, third quarter and upper quarter. The median is described
as the score which is exceeded by fifty percent of the class. The
median is the measure commonly used in computing test norms, because
it is less affected by a few extreme scores and therefore more
truly represents what most people would consider to be the central
trend or tendency of the entire group.
The first six columns of each graph show for a specific test the
distribution of scores in the types of schools studied. The classification
of "school experience" or "type of school attended," assigned
to each student, was on the basis of the type or types of schools
in which he had received a significant amount of his training.
It was at one time considered practical to develop norms and compute
medians on the basis of the school which the students were attending
at the time of testing. This would have meant, for example, that
the norms established for boarding schools would have been based
upon scores obtained by all eighth grade students enrolled in boarding
schools in 1945. However, many eighth grade students in some boarding
schools had only recently come to this type of school, having had
a major proportion of their training in some other type of institution.
It was decided that it would be better to derive norms for the
boarding schools from the scores of students who had spent a significant
amount of their time in boarding schools. For this reason it was
necessary to identify the pupils by the type or types of schools
in which they had received a significant amount of training and
to prepare norms based upon these classifications.
It was then necessary to decide what should be considered "a significant
amount of training." Sample distributions were made of scores of those students
who had spent varying amounts of time in a certain type of school, but there
were no sharp breaks which would give a clue as to what amount of time would
be considered significant. As a matter of fact, there are undoubtedly so many
variables in addition to length of time and type of school that one probably
should not expect to find any simple means of justifying the establishment of
a criterion number of years. It seemed evident from the types of examinations
that were being required that many of these tests called for information and
understanding that would have been accumulated and added to, over a great many
years of schooling. This is particularly true in the case of arithmetic, reading
and English. It is also true that the home economics, health and safety examinations,
and some parts of the resources, were a kind in which the information could have
been gathered almost exclusively during the seventh and eighth grades. It was
finally concluded that a student who had spent three or more of his recent years
in a single type of school should have his grades recorded and reported as belonging
to that type of school. In other words, the student who had spent only one or
two years in the type of school in which he was then a student, had had up to
six years of training in another type of school or schools, and therefore it
is difficult to attribute the degree of success he achieved in the examinations
to any single type of school. An attempt was made to break the data down and
demonstrate the achievement of students having had their training divided between
two types of schools. This was not practical because the group for most combinations
was far too small to warrant drawing reliable conclusions and also it is difficult,
if not impossible, to tell how many years of early training are equivalent to
two or three recent years. Those having received at least two years in Indian
schools were grouped together under the heading of "Miscellaneous Indian" (schools).
The relatively small numbers in the non-reservation boarding school groups at
the fourth and eighth grade levels and the large numbers classified under Miscellaneous
Indian are associated with the fact that many students enter non-reservation
boarding schools already having attended school elsewhere. This is particularly
true in such non-reservation schools as Sherman Institute, which has no grades
below the seventh and therefore, it could have no eighth grade students who had
been regularly promoted with three years in this school.
The remaining columns in each graph describe the distribution of scores in Indian
schools in each of the regions studied and on the test indicated. In the 1945
study, it will be noted that all of the Southwest schools were considered as
a group, whereas in the 1946 study this group was divided into Navajo, Pueblo
and other Southwest. The Alaskan schools were included in the survey for the
first time in 1946. Although tests were administered to a fairly large number
of students in the Alaskan schools, only a relatively small number of students
could be
included in the sample from this area, because much of the necessary
background information could not be obtained.
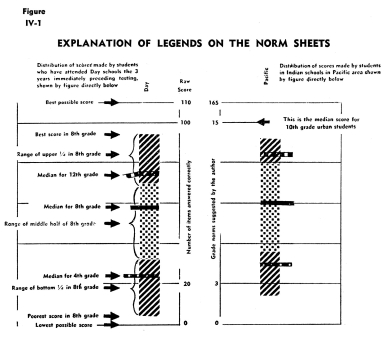
Figure IV-1 explains the legends on the various norm sheets, or
graphs, included in this study. Except for the Gates Advanced Primary
Reading tests, which are fourth grade tests, and the Free Writing
Test, all of the plotted distributions describe the achievement
of the eighth grade students. With the exception of the "Total
Score" of the General Resources, the eighth grade distributions
describe the 1945 results. The eighth grade distributions on the
General Resources test describe the 1946 results, since the original
test was extended and administered to both eighth and twelfth grade
students in 1946. It should be noted that the lines drawn connecting
the medians for each grade are to assist the reader in observing
the differences between schools and areas, and that intermediate
points on these connecting lines have no signficance.
On the graphs for the standardized tests the age or grade norms
supplied by the test author have been inscribed on the graph. The
norms as reported by the test publishers are not suggested standards
for Indian and rural white student populations described here,
but are indicated only because they do provide a yard stick which
is in somewhat familiar terms. In other words, a grade difference
of one grade equivalent means more to the average reader than a
difference in raw score of "6 points" on some unknown
scale.
Reading Ability
The data first listed describes the results on the Gates Reading
Test. All four forms of this examination were given for the purpose
of revealing analytically the difficulties, as well as the skills,
of the different groups of students. There are some differences
between the profiles of the four different forms of the Gates test.
The eighth grade students of the non-reservation and public schools
and students in Indian schools of the Mountain area rather consistently
demonstrated a relatively high level of achievement on all four
of these tests. The eighth grade Indian students in the Southwest
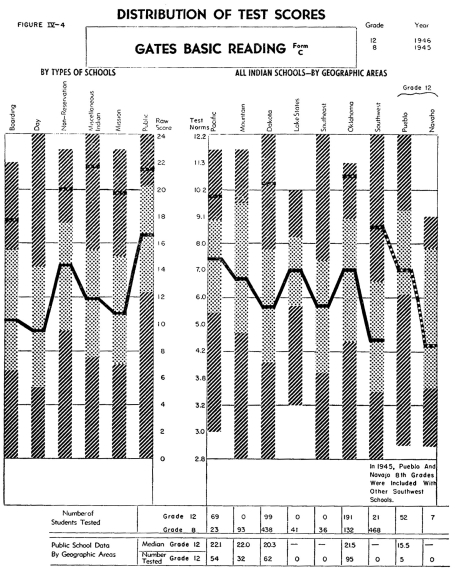
were lowest on all four forms. In the case of Form C, the form
designed to measure a pupil's ability to understand precise directions,
students in Indian schools in the Lake States, Oklahoma and Pacific
areas, do about as well, if not better than those in the Mountain
area. It is interesting to note that the training represented by
Miscellaneous Indian Combinations, which includes students who
have been in two or more different types of Indian schools, do
almost equally as well in these four types of reading abilities
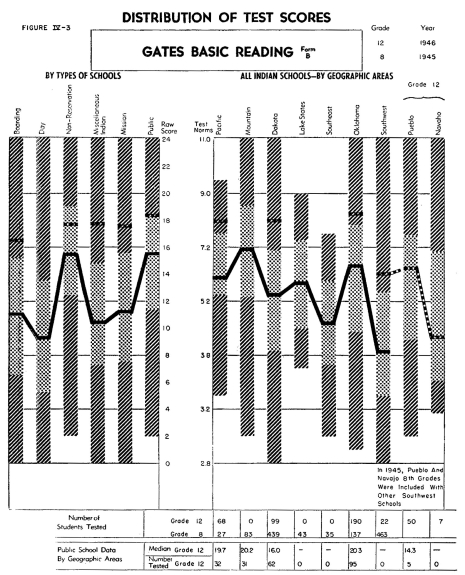
as do other Indian students. Only in Form B, that section measuring
the prediction of outcomes, do these students with mixed training
show any tendency to perform below the general average.
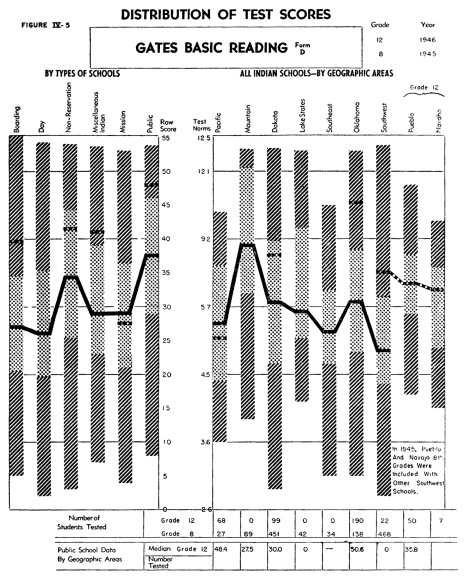
In form A of the Gates Basic Reading Test there appears to be a
significant growth between the eighth and twelfth grade levels,
with marked differences between the twelfth grade groups of the
various types of schools and in the various areas. However, in
Form B, on Predicting the Outcome of Given Events, there is much
less difference between the achievement of the students in the
various twelfth grade groupings. This may be due to a ceiling effect
of the test itself, with the good students unable to show themselves
superior to those of average ability. Because of the fact that
there were only twelve twelfth grade students in the day schools
in the entire Indian Service, in 1946, norms are not shown for
this group.
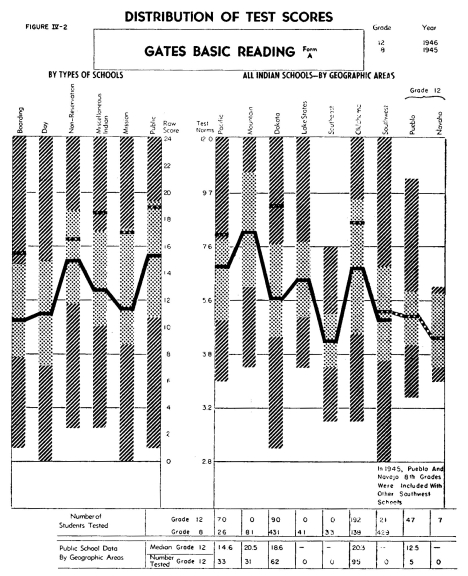
It is interesting that the Indian students often do as well or
better than the public school students in those regions where relatively
few Indian students attend the public schools. Differences between
the achievement of the pupils in different regions may not indicate
superior instruction and educational facilities in the one, but
instead inequalities in the two school populations.
It is important to point out that small deviations between the
medians are not, in most cases, statistically significant, or in
other words, differences of this small magnitude may occur by mere
chance. As an example, on Form B of the Gates Reading Test, it
may be safe to assume that the non-reservation eighth grade group,
with its median of about 15, shows a significantly higher level
of achievement than the group of Indians in the Southwest with
their median of about 8.5. However, while the chart shows that
the Dakota Indians have slightly lower scores than the Lake States
area, this small difference is probably due to mere chance.
The "National Norm Equivalents" have not been provided
with the idea of suggesting any levels of attainment that are expected.
National norms are commonly based upon either urban school children
or, in some cases, a combination of urban and near-urban education.
In view of this, it is obvious that national norms would not be
the proper yardstick to use as a means of measuring or comparing
achievement in this Indian education study. It should be repeated
here that the students tested in the Indian evaluation study all
come from a rural background and were taught in schools having
a rural environment, and therefore these students should not be
compared with the urban students, whose environment and curriculum
are recognized to be quite different. The national norms do help
to provide some concept of the range of abilities, and they also
give one an understanding of the increments between grade levels
in the urban school population. The national norms show the achievement
of the rural students to be, in some instances, much higher than
one might expect.
Figure IV-6 describes the achievement of the fourth grade students
on the Gates Advanced Primary Reading Test, Type I, which is a
measure of general reading vocabulary. While there is considerable
variation in the median achievement recorded for the various groups,
the range of these medians is only about the equivalent of one
school year on the national urban type norms. While the range of
the student scores within each of the groups is extremely large,
varying in most cases from near zero to nearly 100% correct responses,
yet the range of the middle 50% of the students within each group
is quite similar for each of the types of schools and areas,
namely a range of only a little
more than one school year.
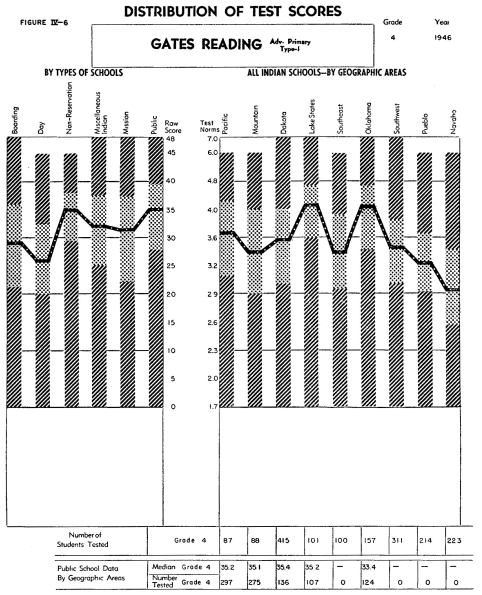
The reading vocabulary skill of the rural public school students
appears to be about the some as that of the urban fourth grade
students and the reading vocabulary achievement of the Indian students,
while equal to that of the public school children in the Lake States,
Oklahoma and Alaskan regions, in no case falls lower than the third
grade urban levels. The fact that both urban and non-urban students
at this level employ about the same basic reading vocabulary is
probably the reason that the deviations from the urban norms are
smaller here than at the eighth and twelfth grade levels. When
one observes, on many of the tests given to the eighth and twelfth
grade students, that the achievement of the Indian students was
as much as two years below that of the national urban norms, one
may be tempted to interpret this as a failure on the part of the
instruction between the fourth and twelfth grade levels in the
Indian schools. This may not be due entirely to instructional lack,
or deficiency, but to any or all of the following factors:
1) the students now being tested in the eighth and twelfth grades
probably do not represent the same type of student now found in
the fourth grade, or, in other words, four years from now the eighth
grade may be made up of students with a higher potential ability
than those now attending eighth grade.
2) for students at the eighth and twelfth grade levels, the national
norm yardstick may not be an adequate means of comparing the educational
objectives of the urban and non-urban schools.
3) students at the fourth grade level have possibly experienced
a more consistent educational program than those in the upper grades.
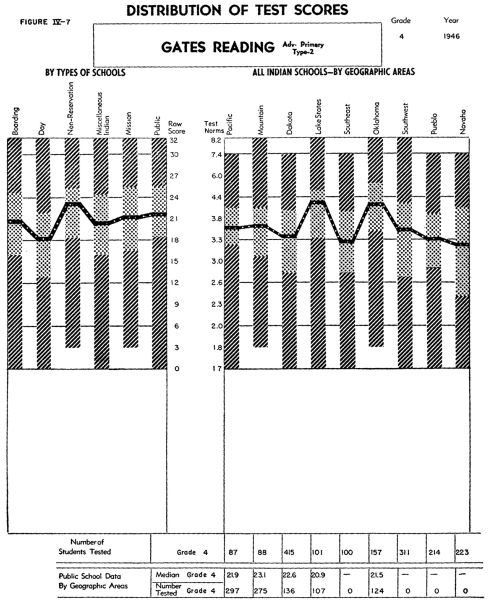
Figure IV-7 describes the achievement of the fourth grade students
on the Gates Advanced Primary Reading, Type 2, which gives a measure
of reading skill in interpreting the meaning of paragraphs. As
in the preceding figure, these data also demonstrate that apparently
the reading skills, as well as the vocabulary skills of the rural
public and Indian schools are similar to those of urban students.
Here, also, the rural public school students attain the achievement
of the fourth grade city school pupils, whereas the Indian School
students in the Lake States and Oklahoma areas exceed that level,
and the reading of the non-reservation and miscellaneous Indian
schools approximates that of the rural public students.
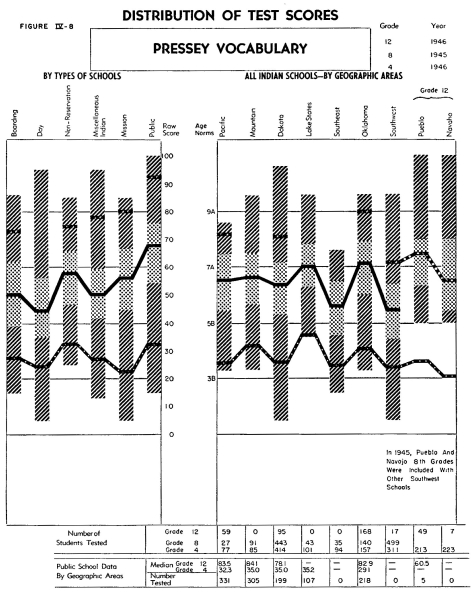
Figure IV-8 describes the achievement of the fourth, eighth and
twelfth grade students on the Pressey Vocabulary Test. This substantiates
the findings described in the preceding paragraph and shows that
all of the fourth grade rural public schools and some types of
Indian Schools tested achieve approximately fourth grade level
on the national urban norms.
The Pressey Vocabulary Examination was given so as to add to the
data obtained from the reading examinations. On the vocabulary
examination the eighth grade rural public school children achieved
the eighth grade level as estimated by national urban norms. It
may be observed that, in general, the vocabulary level was comparatively
higher than the reading level. This would imply that the difficulties
encountered in reading certainly cannot be attributed alone to
lack of word understanding. Instead, the reading difficulties encountered
by the Indian students may be due to little opportunity to read,
or to the fact that it was impossible to find reading tests at
the upper grade levels in which the content of the passages was
suited to rural populations.
Examinations such as the vocabulary test are usually prepared by
surveying the words used or encountered by the group in question.
This would mean that the Pressey Vocabulary test might not be the
one best suited for measuring the working vocabulary of Indian
students, for this test undoubtedly samples best the words encountered
by urban students. Considering this limitation, it is surprising
that the Indian students performed as well as they did on such
a measuring instrument. Considerable thought was given to the construction
of a special vocabulary examination designed for Indian students,
using words and meanings out of their own experience and environment.
A general vocabulary examination could not be constructed and administered
in time for either the 1945 or 1946 battery. However, a special
vocabulary test was constructed and included in the 1946 battery,
whose special purpose was to determine if the vocabulary of certain
tests could have accounted for low achievement in the tests. This
will be discussed later.
Vocabulary growth for most of the types of schools and areas seems
to be about the some for the four-year period between the fourth
and eighth grades as it is between the eighth and twelfth grades.
This means that, in general, the variations that are found between
the schools and areas at one grade level are reflected in the school
achievement at the higher grade levels. The growth in these two
four-year periods is similar for almost all schools and areas.
This may be interpreted to mean that the difference in achievement
at the upper levels of achievement is probably due to some factor
other than difference in school type. The only type of school in
which the growth of vocabulary between the eighth and twelfth grades
is not closely comparable to the growth between the fourth and
eighth grades is in the rural public schools. This may be explained
partly on the ground that the eighth grade students, already having
achieved relatively high scores, find it difficult to demonstrate
on this test their full increment of growth at the twelfth grade
level. In other words, it is possible that this examination exerts
a ceiling effect and does not allow accurate measurement at the
twelfth grade levels. On the other hand, this difference might
also be attributed to the fact that at the tenth, eleventh and
twelfth grade levels the type of vocabulary learned by rural school
children deviates further from that of urban students than it does
at the fourth and eighth grades. A "ceiling effect" on
this test is pointed to by the fact that in many of the schools
and areas some twelfth grade students were able to answer all of
the items on the test.
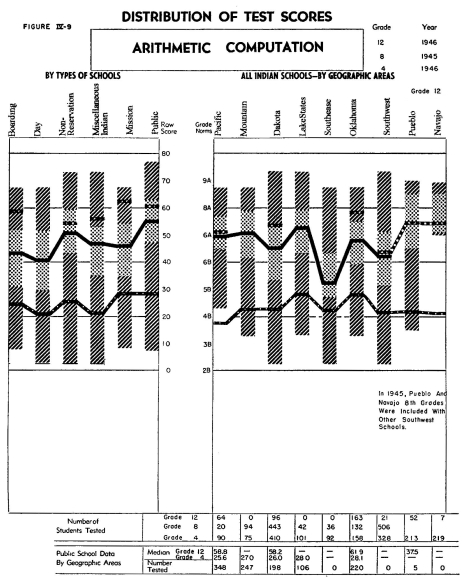
On the Arithmetic Computation test, which requires a number sense,
but little or no reading of words and phrases, the students in
all groups did comparatively well, as indicated by data in Figure
IV-9. While there were variations between groups, only one of the
eighth grade groups had a median lower than Grade 5-A, and the
medians of the eighth grade Indian groups were not more than one
grade level below the median of the eighth grade rural public school
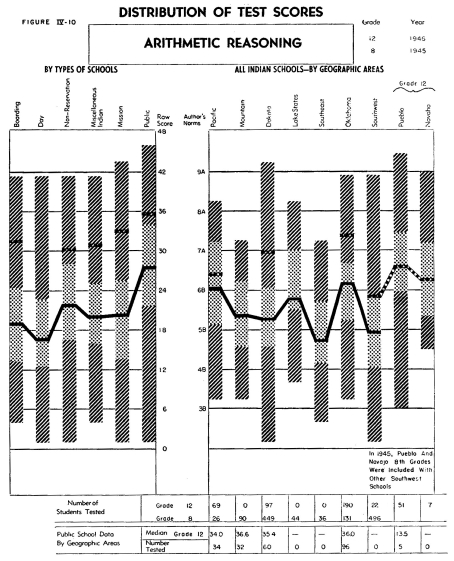
students. The eighth grade medians on the Arithmetic Reasoning
test plotted in Figure IV-10 are considerably lower than those
on the Arithmetic Computation test. The reasoning test involves
not only a number sense and skill in problem solving, but reading
skill, which is in turn dependent upon the use of language and
the understanding of certain experiences unfamiliar to many Indians.
The range of eighth grade medians on the Arithmetic Reasoning test
is from about Grade Equivalent 7-A to below 5-B, with the Indian
groups, as a whole, considerably below the public school groups.
At the twelfth grade level there is less difference between the
achievement of the Indian groups and the public school group, indicating
that the language factor appears to have been less of a handicap
for these twelfth grade students than for the eighth grade students.
Inspection of Figure IV-9 discloses a much greater variability
between the median achievements of the eighth grade students in
the different schools and areas than between the- median achievement
of the different fourth and twelfth grade groups. This is partly
explained by the fact that, for the fourth grade groups, all were
able to demonstrate to about the same degree their understanding
of fundamentals, but it is impossible to account for the similarity
between the twelfth grades on the basis of any ceiling effect when
the twelfth grade students make scores no higher than they do.
The relatively small difference between the achievement in the
eighth
grade and twelfth grade
groups might be accounted for in some cases by the fact that,
in this four-year interval, little attention is given to formal
instruction in arithmetic fundamentals. It should be noted, however,
that this lack of formal instruction should not give the schools
a rationale for this low achievement on the part of the twelfth
grade students, for, during this four-year interval, the teaching
should include sufficient application of principles necessitating
the use of these fundamentals so as to improve the students'
use and understanding of them.
Analysis of the data in which the boarding, day and non-reservation
schools in Oklahoma, Dakota, and the Southwest areas have been
compared by the method of analysis of variance, indicates that
the differences between these three types of schools, at the twelfth
grade level, are probably no greater than that which could have
occurred by chance, but differences as large, or larger than those
occurring between these three areas could probably be interpreted
as significant,* or in other words, not due to mere chance.
The Arithmetic examination is an excellent example by which to
show the relatively high achievement of the Indian groups in Federal
schools. In spite of the fact that much of the Indian student's
time is devoted to special training for rural living and various
trades, he has demonstrated a remarkably high level of performance
in an academic subject such as Arithmetic Computation, in relation
to those students in public schools, who presumably spend a larger
per cent of the school day in instruction in the tool subjects.
The fact that the Indian students do less well on the Arithmetic
Reasoning Test than on the Arithmetic Computation gives added evidence
that the lower level of reading ability is an important factor
in measuring their achievement.
Figures IV-1 1, 12, 13 and 14 describe the data obtained from the
administration of the Pressey English Examination. Here the students
have been given four examinations in English which have yielded
four separate scores. All parts of this test are of interest, because
of the relatively small variations between the medians of the different
eighth grade groups and the rather large range in increments between
the eighth and twelfth grades.
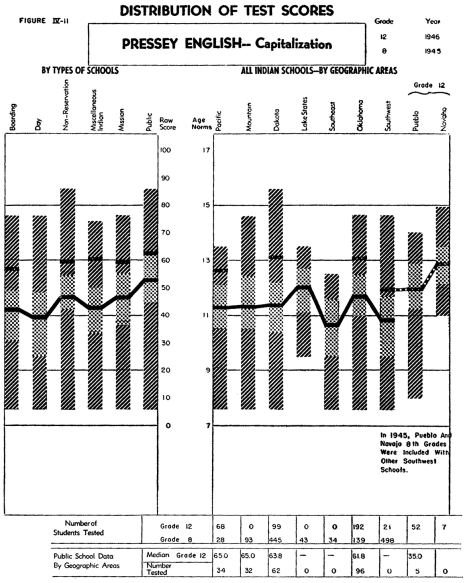
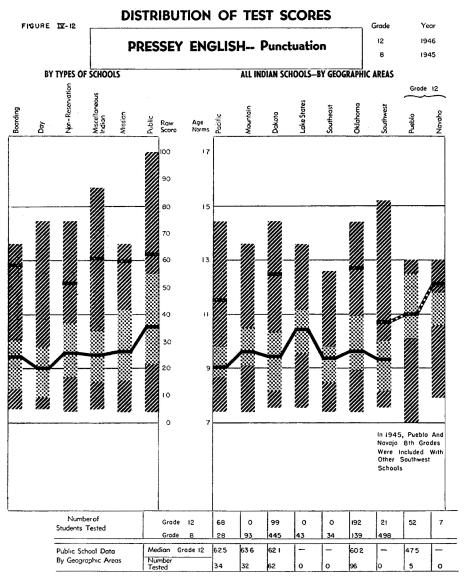
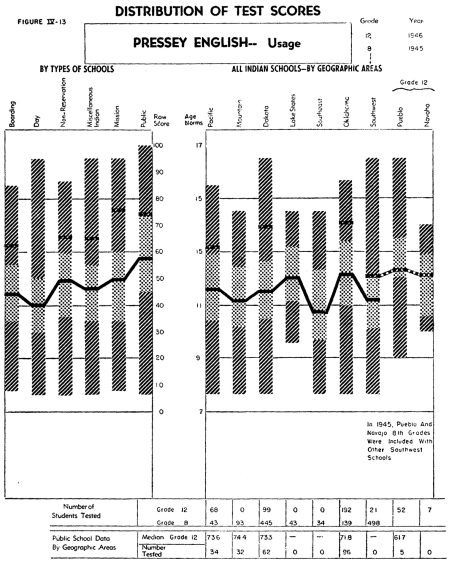
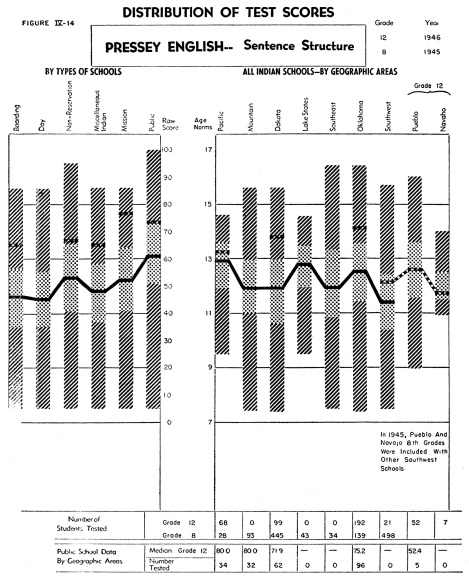
The four separate parts present an interesting profile on the students'
ability to recognize different types of errors in English. In general,
it may be concluded that the students included in this study
probably do their best work on the recognition of errors
in sentence structure and their poorest work in punctuation.
As might be expected, in the Southwest, where the students' growth
in the use of English is more dependent upon his formal school
instruction than in areas where a larger per cent of the students
come from English-speaking homes, the increment of growth between
the eighth and twelfth graders is somewhat smaller than in the
other areas.
The results on this examination must be interpreted differently
from the results on the Free Writing Tests, described in the following
chapter. The Pressey Test requires the students to demonstrate
their competence in a wide range of situations, by establishing
the situation, whereas the Free Writing examinations measure competence
in a situation which the student himself establishes.
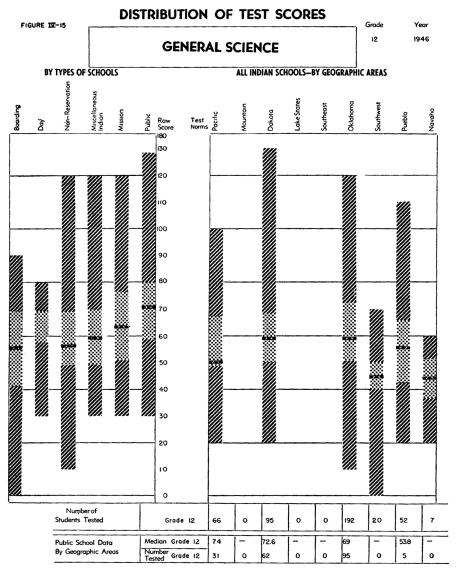
Figure IV-15 describes student performance on the United States
Armed Forces Institute General Science Test. This test is composed
of three sections: Part I - Basic Facts and Information; Part II
- Application of Scientific Principles; and Part III - Scientific
Attitudes and Application of the Scientific Method. The norms available
on this examination are again based upon urban populations and
for students whose courses of study have included from one to three
years of specific training in general science. Analysis of the
test results by its three parts indicates that the Indian students
did very poorly on the last section, namely the application of
scientific method. The relatively low scores on this part resulted
largely from omissions and the fact that many students failed to
complete this part of the test, rather than from an increased percentage
of error on the items which were attempted. Most of the students
did fairly well on the first two parts-in fact, had they performed
as well on the third part as they did on the first two parts, their
standing would have been nearly equal to that on the tentative
national norms. While no data are available to indicate the amount
of specific training included in the courses of study of the rural
public schools, it will be noted that they achieved the level established
by the tentative urban norms.
* Data indicates that differences this large could occur by
chance fewer than five times in one-hundred.
|