The Indian Child Goes To School
CHAPTER VI
THE INFLUENCE OF CULTURAL AND ENVIRONMENTAL
FACTORS ON ACHIEVEMENT
In
Chapter IV we observed that the race-school groups of pupils
in this study arrange themselves into a general order or hierarchy
of achievement. This order
is:
1. White pupils in public schools
2. Indian pupils in public schools
3. Indian pupils in Federal schools
4. Indian pupils in mission schools
What light can he shed on the causes of these differences? In this chapter we
will investigate separately the relationship of a number of cultural and
environmental factors to achievement. The investigators felt that these were
some of the factors which might influence achievement. It was recognized.
of course, that there are other such factors not dealt with in this study; for
example, individual intelligence. Since it has not been possible to hold all
other factors constant while. investigating a single factor, we are not in a
position to say positively that the relationship of any one factor to achievement
is one of cause and effect.
Before proceeding, however, three points need to be made clear. First, there
were great differences in level of achievement among individual pupils in the
same area, in the same type of school, and of the same race. For that matter,
these individual pupil differences were usually large within the same grade
of the same school. Basically, however, we are not treating differences between
individual pupils in this study, although Chapters VII and VIII will he devoted
to describing ways of determining individual pupil differences and taking effective
action in the light of such knowledge. Second, there were undoubtedly marked
differences in the level of achievement among the individual schools participating
in the study, hut the data are not treated in such a way as to differentiate
among individual schools. This could he done from the data at hand and it is
suggested that it should he done whenever a transfer of the pupils of one of
the participating schools to another is contemplated in the future. Third,
the differences we are discussing here are characteristic of large groups of
individual pupils enrolled in a large number of individual schools. We are concerned
with the factors related to such differences in achievement because we believe
that by studying them we may better understand the factors which influence the
learning of children everywhere.
It scarcely can he doubted that there were wide differences in the quality of
the schools that participated. Teachers are not all equally well trained and
equally effective. Some schools have better planned curricula than do others.
The teaching materials and equipment in one school may be much superior to those
in another. Furthermore, the writers are entirely convinced that the quality
of a school and its instructional program has much to do with how well or how
much its pupils learn. It must he pointed out, however, that differences which
are wholly individual in character, whether of pupils, teachers, or schools,
probably tend to approach a normal distribution when taken together for an entire
administrative area of this study. The good quality of some will counterbalance
the poor quality of others.
Still we are faced with the hierarchy of achievement of race-school groups set
out at the beginning of this chapter. What thread of influence runs through these
groups and accounts for these rather clear-cut differences? It might be
supposed, as was pointed out in Chapter IV, that the instructional programs of
the three administrative types of schools differ markedly enough from each
other in quality to account alone for the differences in achievement. One fact
stands as a bar to such a conclusion. If the instructional program of the school
alone controls the level of achievement of pupils, why do Indian children who
attend public schools not achieve as high as do white children who attend
public schools? And yet they do not do so in any one of the six administrative
areas included in this study.
DEGREE OF INDIAN BLOOD AND PRE-SCHOOL LANGUAGE
Manifestly, we must look beyond the instructional programs of the schools for
an explanation of the differences in achievement among the race-school groups.
What of the pupils themselves? Are the pupils who comprise the various race-school
groups different from each other, on the average, in any basic respects? An examination
of Tables 6-a through 6-g will disclose that in two particulars they are strikingly
different from each other
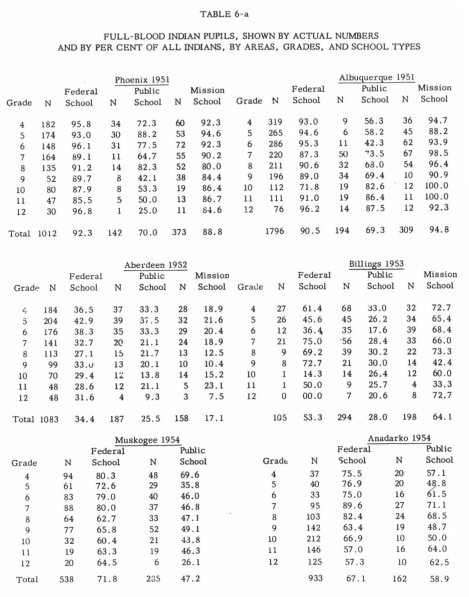
Table 6-a shows the percentages of full-blood pupils in each of the three Indian
groups: Federal school, public school, and mission school. In each of the six
administrative areas a smaller percentage of the Indian pupils attending public
school were full-bloods than was true for either Federal or mission schools,
with one exception. This occurred in the Aberdeen Area where the mission schools
enrolled a smaller proportion of full-bloods than did either the Federal or public
schools. In the Albuquerque and Billings Areas the mission schools enrolled an
even higher percentage of full-blood pupils than did the Federal schools, and
in the Phoenix Area the proportion was very little lower.
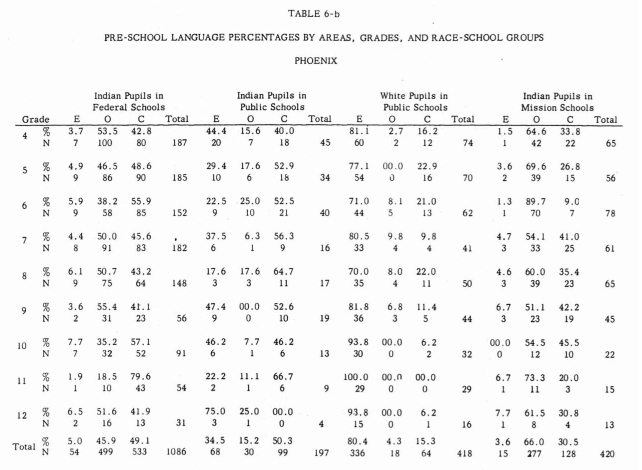
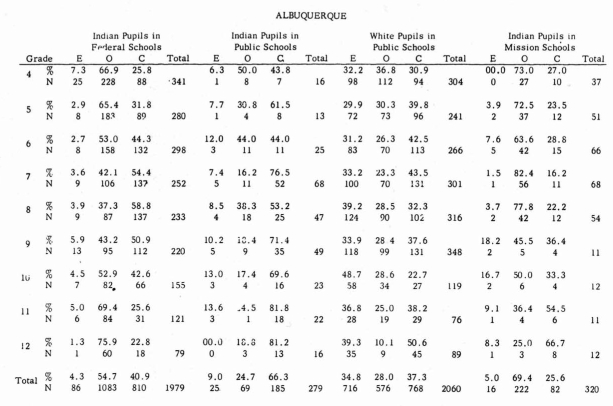
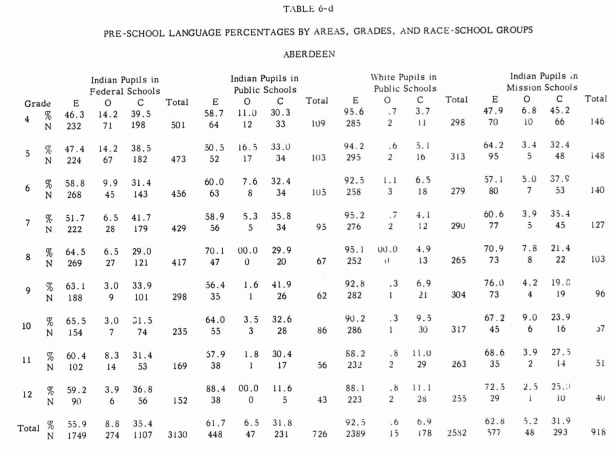
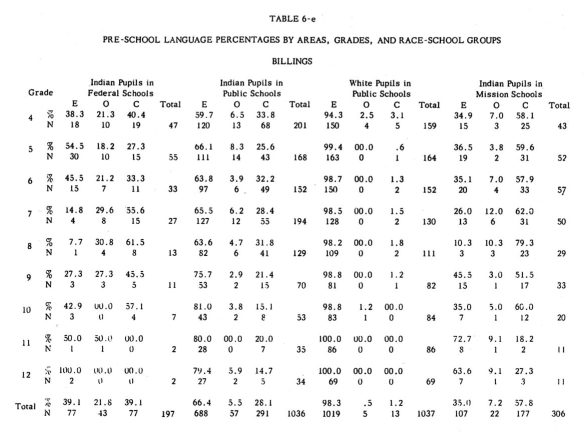
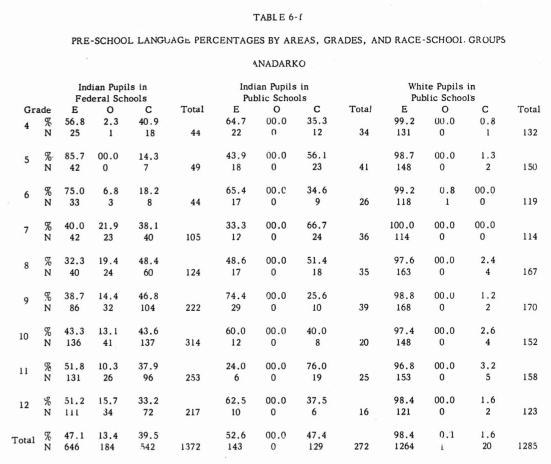
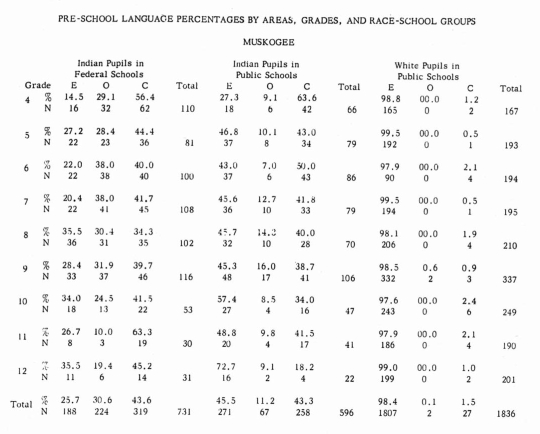
Tables 6-h through 6-g show in percentages, by areas and by grades, the pre-school
language spoken by each of the race-school groups. Without exception a larger
percentage of Indian pupils in public schools spoke only English and a smaller
percentage spoke only some other tongue than was true for Indian pupils attending
Federal schools. As a general rule even fewer Indian pupils attending mission
schools spoke only English and more spoke only some other language, prior to
school entrance, than was the case with Indian pupils attending Federal
schools. Again, a notable exception to this rule occurred in the Aberdeen Area
where the situation was reversed. In all areas except Albuquerque a great preponderance
of the non-Indian children spoke only English prior to school entrance and a
minute percentage spoke only some language other than English. Even in the Albuquerque
Area a far higher percentage of the non-Indian pupils in the public schools spoke
only English prior to entering school than was true for any of the Indian groups.
Thus, on the bases of full-blood pupils and pre-school language the race-school
groups arrange themselves into hierarchies which coincide with the hierarchy
of achievement. That is, the higher achieving groups enrolled a smaller
percentage of full-blood pupils, a smaller percentage of pupils not speaking
any English prior to school entrance, and a higher percentage of pupils speaking
only English prior to starting to school.
Degree of Blood and Pre-School Language as Indices of Acculturation
It should be made clear that the writers do not believe that blood quantum and
preschool language in themselves are strong determiners of achievement.
They do believe that these two characteristics are excellent indices, on the
whole, of the stage of acculturation of the groups of pupils. Finally, they believe
that the extent to which a family or community has integrated itself with the
dominant culture of the nation has a very great influence upon the school achievement
of its children.
The foregoing statement needs clarification in several respects. Many full-blooded
Indians are completely acculturated and have reached a high level of sophistication.
In general, however, it is probable that the white person, or the person
of mixed-blood has had greater opportunity to acquire the attributes of the major
culture, of which knowledge of the English language is one, but only one.
There is evidence available which indicates that by the fourth grade level the
school may he successful in overcoming in large part the pupil’s handicap
of lack of pre-school English in learning the basic skills. Later on, however,
and particularly by grade six, the same pupils may again fall farther behind
their classmates who come from English-speaking homes.1 It
must be remembered that the influence of the home and community on the child
does not cease when he enters school. If he returns each evening to
a home in which English is not spoken he will get no help and scant encouragement
there in developing English skills. Up until grade four, for example, all
pupils are developing verbal and numerical skills which are very basic to their
everyday needs and common experiences. In the higher grades, however, the learning
experiences involve concepts which are more abstract and farther removed from
the everyday needs of the learner as he feels them. If the home, or the community
for that matter, is not able to keep pace with these expanding learning situations
in the school, it can contribute little to the learning process.
Defining “Acculturation.” We often use the term “acculturation” as
if its meaning must be clear to anyone hearing it. This certainly is taking too
much for granted. There is an obligation to define “acculturation” as
it applies to pupils in this study. A dictionary definition of acculturation
is, “the process and result of adopting the culture traits of another group.” Without
presuming to treat the subject exhaustively, it may be helpful to cite some
examples of traits which are felt to be characteristic of the major part of
the population
of the United States and which the lower achieving groups in this study probably
possess in lesser degree than do the higher achieving groups.
I. Habitual use of spoken and written English in the home and community as a
means of communication. The presence of books, magazines, a daily newspaper,
radio, and perhaps television in the home.
2. Regular, useful, and gainful employment of the bread-winner of the family.
The possibility of the children of the family looking toward adulthood with confident
expectation of desirable employment opportunity.
3. Participation with one’s neighbors in the educational agencies
of the community, other than schools, such as the churches, Scouting, and
4-H clubs.
4. Participation by adult members of the family in civic and community affairs
such as voting, active membership in service clubs, veterans organizations, farmers
cooperatives, etc., to mention only a few.
5. A reasonably good understanding of and concern for proper diet and health
practices, particularly as they concern the younger members of the family.
6. Acceptance of a set of values which attaches importance to such traits as
industry, thrift, punctuality, acquisitiveness, competitiveness, and independence.
(Whether all of these traits are virtuous, especially when carried to an extreme,
may be debatable. It is felt that they are typical of the major culture of the
country.)
How Acculturation Is Accomplished. It must be obvious that the above list could
be expanded, almost ad infinitum. It is clear, however, that even the six points
listed are not solely within the immediate control of the school. The writers
would be the first to place the school at the head of a list of acculturative
agencies of society. The benefits of education, however, find their most
effective expression in home and community life. Usually it is only after the
pupil himself has reached adulthood and becomes the head of a family that his
education makes itself felt in changing culture patterns. Thus, generation by
generation the process of acculturation progresses. This “delayed action” type
of progress is frustrating to those persons who impatiently expect people to
be “made over in a day” and who seem to believe that if the schools
are run effectively this should be possible.
Furthermore, however well the schools may do their job, the task of helping Indian
people to achieve lull status in American life calls for cooperative effort on
a broad front. It
is neither the prerogative nor the desire of the writers to lecture the Indian
people concerning any obligation on their part to acquire the traits of
the dominant culture. The writers feel they should point out, however, that Indian
people face an alternative—perhaps a hard one. For except as Indian people
embrace the major culture it seems unlikely that their children, on the
average, will learn as well or as much in their school subjects as do white children.
Nor is the problem unilateral in its aspects. Non-Indian people cannot reasonably
expect that Indian people will enthusiastically embrace the major culture unless
they arc encouraged and helped to do so.
Reconciling Two Exceptions to the General Hierarchy of Achievement
How can the two exceptions to the general hierarchy of achievement of race-school
groups be explained: namely, the relatively high position of mission school pupils
in the Aberdeen Area and of Federal school pupils in the Albuquerque Area So
tar as the Aberdeen Area is concerned, the fact that mission school pupils
achieved at a higher level than Federal school pupils, and at least as high as
public school Indian pupils, is perfectly consistent with the main premise
set forth in this chapter thus far. That is, the mission schools in the Aberdeen
Area enrolled a smaller percentage of full-blood Indian pupils than did either
the Federal or public schools. Furthermore, a larger percentage of mission school
Indian pupils spoke only English prior to school entrance, and a smaller
percentage spoke only another tongue, than was true of either Federal or
public school Indian pupils.
The relatively high achievement of the Federal school pupils iii the Albuquerque
Area does not yield to such a ready explanation. Here the Indian pupils in Federal
schools achieved significantly higher than did the Indian pupils in public schools.
Also, there was no significant difference between the level of achievement of
public school Indian pupils and those in mission schools. No objective data can
he adduced to account satisfactorily for this departure from the typical hierarchy
as described in Chapter IV. A substantially higher percentage of the Federal
school pupils were full-bloods than was true for the public school Pupils.
The mission schools enrolled a higher percentage of full-blood pupils than did
either of the other types of schools. Also, a much lower percentage of public
school Indian pupils spoke only some language other than English, prior to school
entrance, than was true of either Federal or mission school Indian pupils.
Without question the Federal schools of the Albuquerque Area (now the United
Pueblos Agency) enjoy certain advantages not shared by those of some of
the other areas. First, the Pueblo villages were fairly compactly located with
respect to area headquarters, facilitating effective supervision of the
schools. The education staff of the Bureau has taken full advantage of this circumstance
to do excellent work in the supervision of instruction, cooperative curriculum
planning and preparation of teaching materials, and in evaluation of the educational
program. Second, the Pueblo people live in villages, immediately adjacent to
which the Federal day schools have been placed. The Pueblo People have had for
centuries a relatively stable culture and a closely knit community organization.
As a result the day schools have become closely integrated with village community
life. One result of this has been that the average daily attendance of the Federal
day schools approaches a highly satisfactory 94 percent, as disclosed by
attendance records independent of this study.
It may be important to note that the non-Indian pupils in the public schools
of the Albuquerque Area differ markedly in one respect from any other non-Indian
group in this study. Twenty-eight percent of them spoke only some language other
than English before starting to school (mostly Spanish) and 37.3 percent spoke
a combination of English and some other language. Only 34.8 percent spoke only
English prior to school entrance. They were the lowest achieving of all the non-Indian
public school groups in the study, although they achieved significantly higher
than any of the Indian groups in the Albuquerque Area. One can only speculate
as to whether they exercised less acculturative influence on their Indian classmates
in the public schools than did their non—Indian contemporaries in the other
areas.
AGE OF PUPILS IN RELATION TO GRADE
On the average, Indian children are older for their grade than are white pupils.
Age-grade data in this study reveal that, in general, the average age of Indian
pupils in Federal schools was slightly more than a year greater than that of
white children in public schools in the same grade. Indian pupils in public schools
were approximately six months older, on the average, than their white classmates,
while Indian children in mission schools were, in general, nearly a year older
than white pupils of the same grade in the public schools. These findings are
very similar to those of Peterson2 in 1946 and of Anderson3, et al, in 1950.
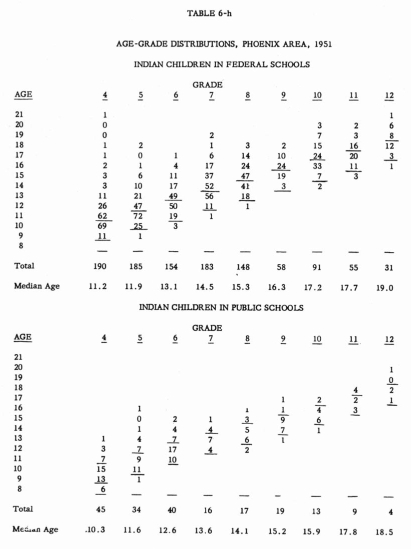
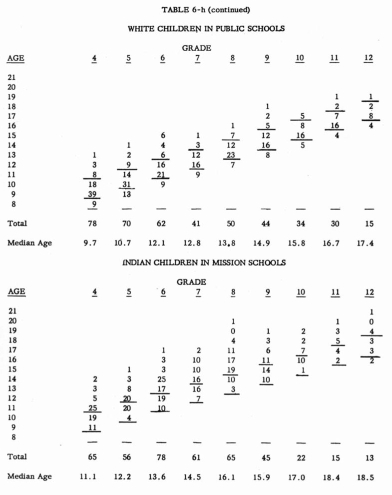
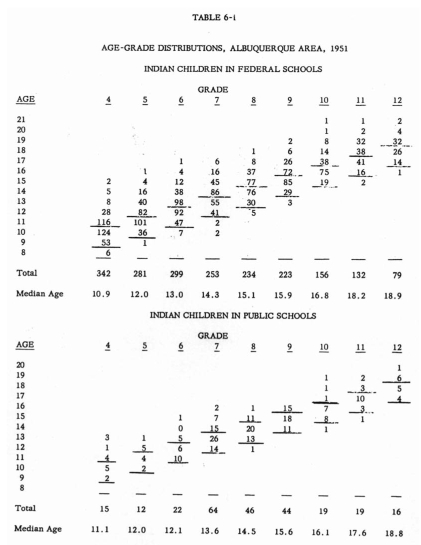
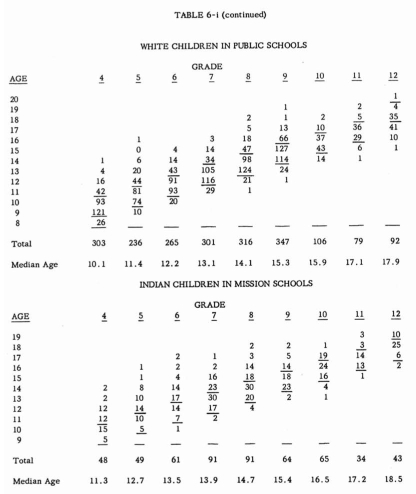
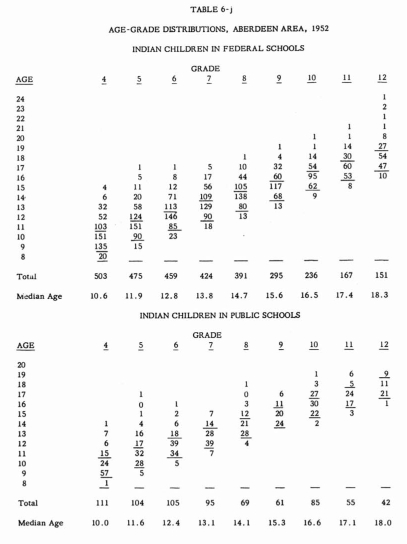
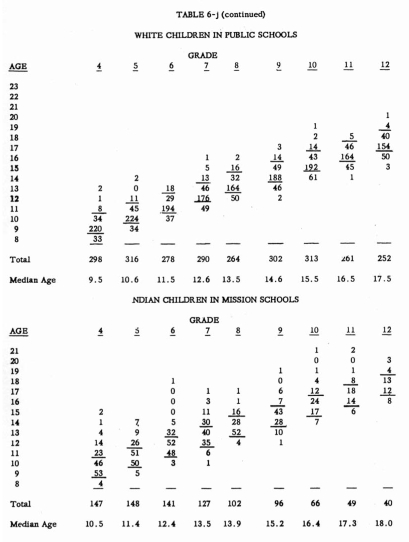
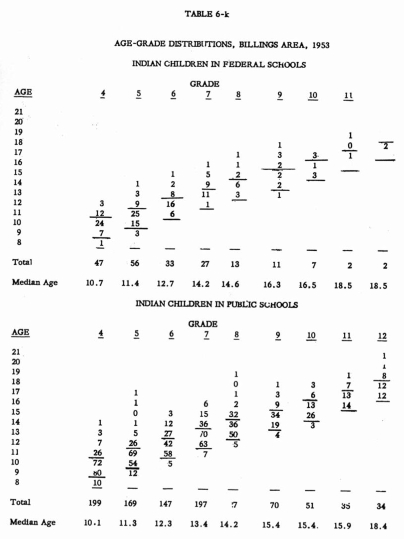
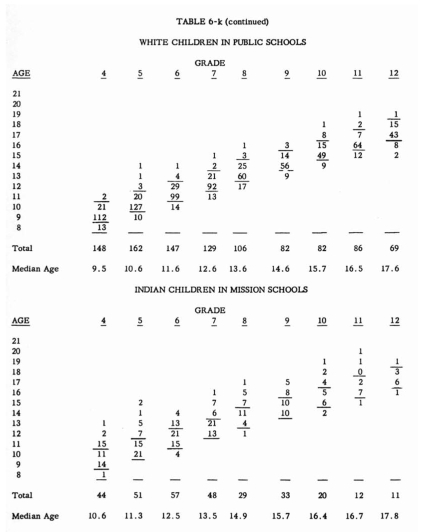
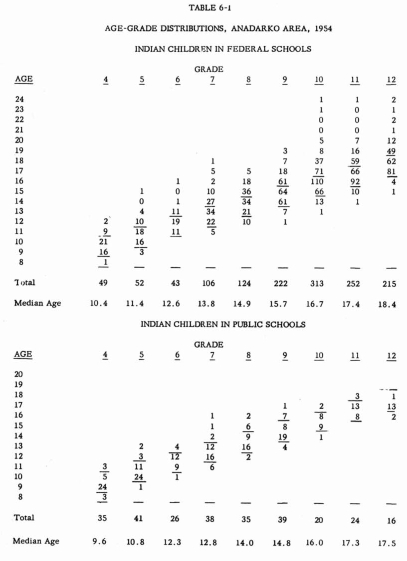
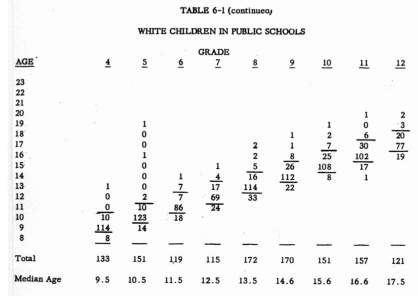
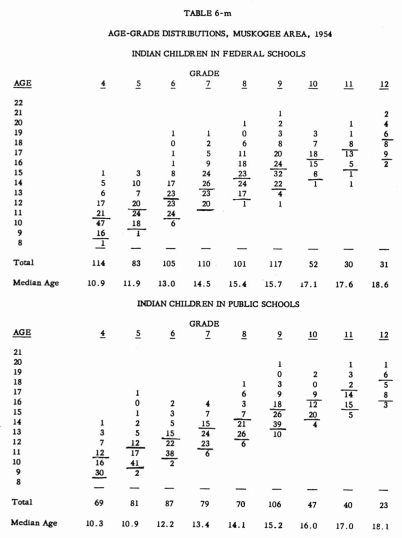
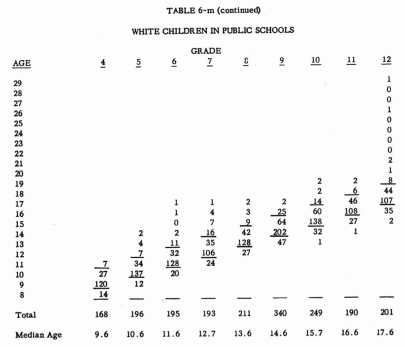
Tables 6-h through 6-rn show the distribution of pupils in the study by age and
by grade for each of the six areas. Pupils falling within the normal age range
for a grade are set off by the staggered lines. The determination of what is “normal” age
for a grade was based mainly on the data themselves. Ages nine and ten included
more fourth-graders (the lowest grade in the study) than did any other two successive
ages. Fourth-grade pupils who were either nine or ten years old at the time the
tests were given were thus identified as “at grade” for their age.
Those who were older or younger were identified as “over-age” or “under-age”,
respectively. By a regular progression. normal ages for each of the succeeding
grade levels were determined by adding one year for each grade. Tables 6-h through
6-rn also show a median age for each race-school group, for each grade in each
area.
The average over-ageness of Indian pupils as compared with white pupils was not
the same in all of the areas. For Indian pupils in Federal schools it was greatest
in the Phoenix arid Muskogee Areas and least in the Albuquerque Area, ranging
from about one year and four months for the former to about eleven months for
the latter. For Indian pupils in public schools it was greatest in the Aberdeen
Area and least in the Anadarko Area, with a range from approximately nine months
to about four months. The greatest over-ageness for Indian pupils in mission
schools occurred in the Phoenix Area and the least in the Aberdeen and Albuquerque
Areas, ranging from about one and a half years to about nine months.
Some Reasons for the Over-ageness of Indian Pupils
It should be remembered that bate entrance into school accounts for some. but
by no means all of the over-ageness of Indian pupils. For those pupils who speak
little or no English prior to school entrance, Federal schools have found
it necessary to require a beginning year. During this year skills in spoken English
are developed and the child is helped to acquire a background of experience
which will make formal instruction in the basic skill subjects, beginning
with grade one, more meaningful to him. Presumably public and mission schools
which enroll children with a similar problem must do much the same things. Undoubtedly
the necessity for this beginning year contributes substantially to the general
aver-ageness of Indian pupils.
Another factor which may account in part for the tendency of Indian pupils to
be older for their grade than white children of the same grade is the frequency
with which Indian children in some localities fail to attend school during
an entire school year. Lack of stability in the social and economic bite of many
Indian families mainly accounts for this. For example. in some localities some
families withdraw children from school for considerable periods of tune
while the adults, and the older children, engage in migrant seasonal labor. The
families need the income from this type of work because of poor resources au
the reservations. but prolonged periods of absence from school may, of course,
necessitate a pupils repeating a grade. School authorities are striving hard
to correct this situation by finding means of keeping the children in school
while the adults are away from
home working.
It is not believed that there is any widespread practice, in Federal schools
at least, of retaining a pupil in a grade for a second year because of academic
failure. The writers cannot speak with authority concerning the promotional
policies of public and mission schools.
Other Observations
Referring again to Tables 6-h through 6-rn, it will b~ noted that in general
the range of ages in a given grade was greatest for Indian pupils in Federal
schools and least for white pupils in public school. It will he observed, too,
that generally the range of ages within a grade lessened for each race-school
group from grade four through grade twelve. The writers believe that this
latter phenomenon is brought about largely by the dropping out of school of over-age
pupils as the higher grades are reached.
For the most part, in any grade in any area the concentration of ages for white
pupils in public schools was in one or two years, while the concentration of
Indian pupils in Federal schools was usually in three or four different years.
Although no data relating to the sex of pupils is given in the age-grade tables,
it was observed by the investigators that, regardless of race-school groupings,
the preponderance of pupils who were over-age for their grade were boys and the
majority of pupils who were under-age for their grade were girls.
It appears from the data that, except in the Albuquerque and Phoenix Areas, Indian
and white pupils tend to he more nearly the same age in the eleventh and twelfth
grades than was true for the earlier grades. Again, we find here a suggestion
of heavy drop-out of over-age Indian pupils at the highest grade levels.
The Relationship Between Age in Grade and Achievement
A study of the data reveals, furthermore, that there is a definite relationship
between the over-ageness or under-ageness of the pupils in this study and their
achievement in the basic skill subjects. There is impressive evidence that, on
the average, those pupils who were over-age for their grade did not make as high
scores on the tests as did the pupils who were of normal age for their grade.
The data indicate, somewhat less conclusively, that in general the pupils who
were under-age for their grade did somewhat better on the tests than did those
falling within the normal age range. A word of explanation and of qualification
about this latter statement is necessary and will he given later.
A comparison of the achievement of at-age, over-age, and under-age pupils, on
total score only, was made for each area, in each grade, and for each race-school
group whenever the number of pupils in a 4atcgory was large enough to insure
a reasonable degree of reliability. No comparison was made when the number of
pupils in a category fell below thirty. Table 6—n shows the results of
these comparisons. It will be noted that the table shows the differences between
mean scores for various pairs of age groups. The mean score of the second group
has been subtracted from the mean score of the first group.
In all it was possible to make sixty-eight comparisons. Of these, fifty-one were
comparisons of over-age pupils with those who were at-grade for their age.
Of the fifty-one comparisons, forty-three showed that pupils who were of normal
age for their grade achieved significantly higher on the average than did those
who were over-age. In only one instance (tenth grade in Federal schools of the
Albuquerque Area) did over-age pupils actually make a higher average score than
pupils who were at-grade for their age.
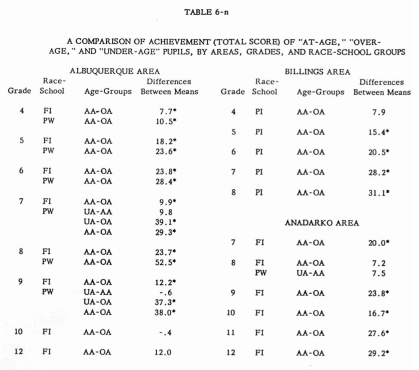
Differences between means are of total raw score and were obtained by subtracting
the mean of the second group from the mean of the first. All differences except
those preceded by a minus sign indicate that the first group in the comparison
had the higher average or mean score.
*Significant at or beyond the .05 level of confidence. (Apparent inconsistencies,
in that some differences are not significant whereas smaller differences are,
are attributable to the smaller number of pupils in a group. For these numbers
refer to Tables 8-h through 6-m.) 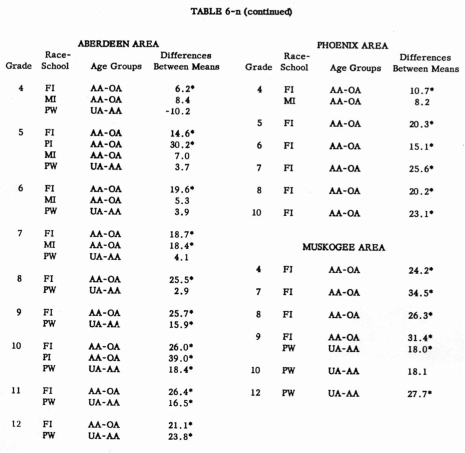
Of the remaining seventeen comparisons, fifteen compared the achievement of under
age pupils with thos of normal age. Of these, six showed the under-age pupils
to be significantly higher. In only two of the fifteen comparisons did the at-age
pupils actually make higher average scores than those who were under-age.
The remaining two comparisons were of under-age and over-age pupils. In both
of these the under-age pupils were significantly higher.
Except in the Albuquerque Area, all of the over-age comparisons were of Indian
children. Without exception time under age comparisons were of white pupils.
It must he noted that most of time pupils who are here classified is under-age
would not be considered so in many, or perhaps in most, of the schools of the
nation. The normal age-grade range as defined in this study is perhaps one year
higher than in the typical school. Therefore, there is no justification whatever
for concluding that starting children to school at an unusually early age or
accelerating them unduly helps them to learn.
The writers do not believe that over-ageness in itself is the sole contributor
to the tendency of over-age pupils to achieve less well than those of normal
age. It is probable that social, economic, and cultural factors in the home and
community which may have caused the pupil to be over-age in the first place will
continue to operate against his learning, It is true, however, that being over-age
for his grade may hamper a pupil’s social adjustment in the school and
cause serious loss of interest in motivation.
Once again, the reader should bear in mind that we have been speaking in terms
of averages. There were, of course, some over-age pupils who achieved higher
than some pupils who were of normal age for their grade.
The “Holding Power” of the School
One of the perennial concerns of the school is its “holding power.” However
effective or ineffective the program of the school may be in educating the child,
it obviously can do nothing for him if he is not present. It therefore behooves
any school to examine its “drop-out” problem closely – to see
whether it is alarmingly high and to determine, if it can, why children drop
out of the school prior to the completion of the twelfth grade. Incidentally,
it is often very difficult to determine the true reasons for a pupil’s
dropping out of school. Inevitably, since Indian children attend three different
types of schools, there is considerable interest as to which type does the best
job of holding Indian children in school.
Unfortunately the data in this study are not of such a mature as to throw much
light on this question. There are several reasons for this:
(a) The data were all gathered in a given year for a given area and thus do not
represent thc progression of the same children from grade four toward or through
grade twelve.
(b) The increasing in influx of students into the lower grades, typical of the
country as a whole in recent years, is not taken into account.
(c) In organizing the study, there was no attempt to control closely the selection
of participating schools with the dropout question in mind. To have done so would
have seriously handicapped the study in other important respects. The general
aim was to test all children in Federal schools in an area and approximately
the same number of pupils in public and mission schools combined. Public schools
enrolling a considerable proportion of Indian pupils, and operating in the same
general localities as Federal schools, were invited to participate. Participation
was entirely voluntary, however, and depended largely upon the interest of public
school administrators and teachers.
Examples of unusual enrollment situations which resulted were:
(1) In many communities public high school pupils are bussed in from smaller
rural communities which operate their own elementary schools and which may not
have participated in the study. This served to make the hij1h school enrollment
larger by comparison with elementary enrollment than it would normally be. The
Aberdeen, Muskogee, and Anadarko Areas offer excellent illustrations of this.
On the other hand, an opposite situation might exist: the elementary school may
have participated in the program whereas the high school in another community
to which the pupils are bussed did not.
(3) Indian children often transfer from Federal day schools or public schools
to Federal boarding schools, sometimes in a different area. For instance, Flandreau,
in the Aberdeen Area, enrolls pupils from the Billings Area; Chilocco and Haskell,
while administratively in the Anadarko Area, enroll many pupils from the Muskogee
Area.
(3) There is always some transferring of pupils among public, mission, and Federal
schools at all grade levels.
Nevertheless, with due regard for the limitations mentioned above, there are
indications from the data that Indian children the country over are not
staying in school to the completion of their high school education in as large
proportions as do white children. The data shown below seem to support this conclusion.
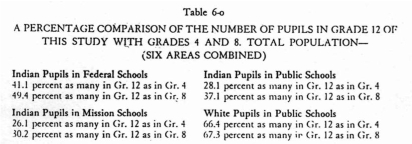
In 1950 there were 49.8 percent as many twelfth-graders as fourth-graders for
the country as a whole and 77.7 percent as many twelfth-graders as eighth-grade
pupils.4 These percentages for the Indian population in this study are well below
that. They are shown in Table 6-o, below.
Unquestionably the “holding power” of the school for Indian pupils
is a matter of severe educational concern. A need for a much more rigorous and
exhaustive survey of this problem is indicated.
RESIDENCE ON OR OFF A RESERVATION
There is strong evidence that Indian pupils who live on a reservation do not
achieve as well in the basic skills, on the average, as those who do not. This
comparison was made on total score only, by areas, by grades, and by race-school
types. Again, for reasons of reliability no comparison was made when the
number of pupils in any category fell below thirty. As a result, no comparisons
were possible in the Albuquerque, Billings, and Phoenix Areas for time reason
that there were not enough pupils whose homes were off Indian reservations.
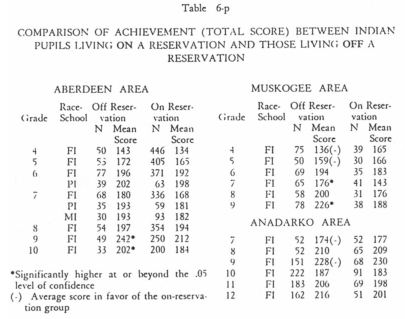
Comparisons which could be made in the Aberdeen, Anadarko, and Muskogee Areas
are shown in Table 6-p.
In all, twenty-two comparisons were possible. Ten of these were in the Aberdeen
Area with six each in the Anadarko and Muskogee Areas. All but three of the twenty-two
comparisons were of Indian pupils in Federal schools; two were o Indian pupils
in public schools amid the remaining one was of Indian pupils in mission schools.
Only four of the separate comparisons revealed differences which were statistically
significant. All four of these showed Indian pupils living off reservations to
be higher. This evidence taken alone would not he very conclusive. However, it
was observed that in only four of the twenty-two comparisons did Indian pupils
living on a reservation actually make a higher average score than those living
off. This was true for two of six comparisons in the Anadarko Area and for two
of six in the Muskogee Area. In the Aberdeen Area the “off-reservation” groups
were unvaryingly higher. How likely is it that the apparent superiority
of the “off-reservation” group occurred by chance alone? Statistical
investigation5 revealed that this probability was less than one in two hundred,
either for the three areas combined or for each area taken separately. This finding
greatly strengthens the conclusion that Indian pupils who live on reservations
do not achieve as high on the average as those who do not.
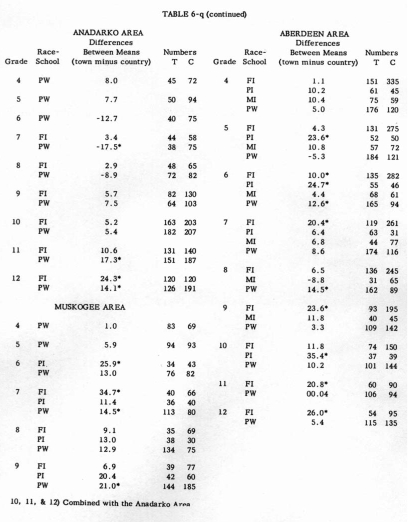
RESIDENCE IN A TOWN OR IN THE COUNTRY
We may conclude from this study that, in general, pupils who live in a town achieve
higher in the basic skills subjects than do those who live in the country.
Pupils in this study were asked whether they lived in a city or town or in the
country. Comparisons were then made between the city-town groups and the
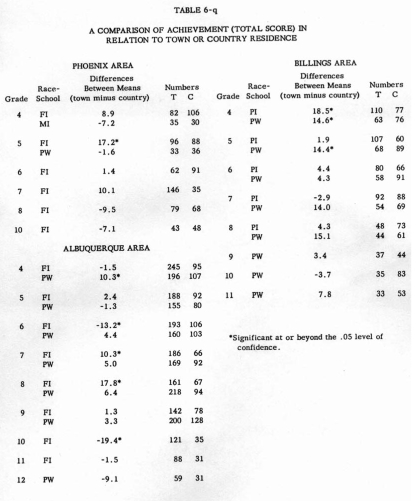
country groups on the basis of achievement (mean total raw score). Table 6-q
shows the results of these comparisons by areas, grades, and race-school groups.
It also shows the number of pupils in each category.
In all, ninety-three separate comparisons were possible, after meeting the requirement
of a minimum of thirty pupils in a category in the interests of reliability.
Of these. seventy-six produced differences which were in the direction of the
town pupils; only seventeen differences were in the direction of the country
pupils. Twenty-four of the seventy-six differences favorable to the town
pupils were statistically significant. Only three of the seventeen differences
in the direction of the country pupils were significant.
The ninety-three comparisons were divided among the race-school groups as follows:
white pupils in public schools, forty; Indian pupils in Federal schools, thirty-two;
Indian Pupils in public schools, fourteen; Indian pupils in mission schools,
seven. Regardless of race or type of school, the evidence strongly indicates
the superior achievement of pupils who live in town.
An inspection of Table 6-q will reveal that the superiority of the town dwelling
pupils was not as clear-cut in the Phoenix and Albuquerque Areas as it was
elsewhere. Ten of the seventeen differences favorable to country dwelling pupils
occurred in these areas. We cannot be sure that the slight general tendency of
town dwellers in these areas to be superior in achievement did not occur
by chance. In all other areas, however, and for the study as a whole the higher
average achievement of pupils living in town was highly significant.
It should be pointed out that many of the pupils living in the country attended
school in town, particularly in the high school grades. It is not felt that rural
day schools alone account for the differences in average achievement.
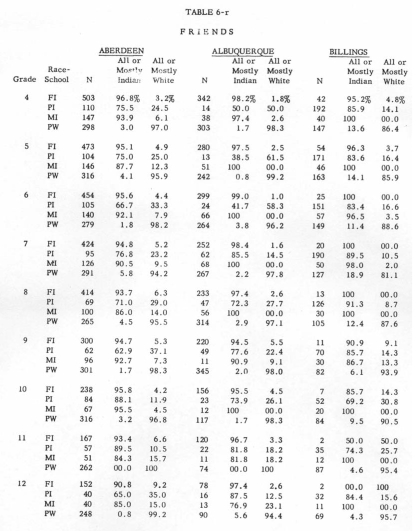
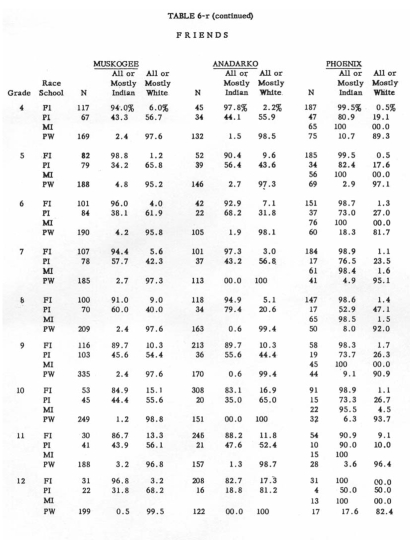
THE CHOICE OF FRIENDS BY INDIAN AND WHITE PUPILS
It has seemed to the investigators in this study that the extent to which individuals
of one race, given opportunity, select their friends from among individuals of
another race is a valuable indication of the stage of social integration of the
two races. The choosing of friends is a very personal matter. Each of the pupils
in this study was asked to check one of the following statements about his friends:
I. all of them are Indian boys and girls; 2. most of them are Indian, some are
white; 3. most of them are white, some are Indian; 4. all of them are white boys
and girls. To help the pupil understand what was meant by “friends,” the
person administering the tests suggested that friends are the persons with whom
we usually play.
In treating the data. responses to items I and 2, above, were added together,
and likewise the responses to items 3 and 4. Table ô-r shows, by areas
and by grades, the percentage of pupils in each race-school group who said their
friends were all or mostly Indian boys and girls and the percentage who said
their friends were all or mostly white boys and girls.
It was to he expected that since the Federal and mission schools enroll few,
if any, white pupils a small percentage of Indian pupils in these schools would
say that their friends were all or mostly white. This proved to be true, although
this percentage does run in excess of IS percent for a few Federal and mission
school groups in some of the areas. Pupils were not expected to interpret “friends” to
mean only those pupils with whom they were currently attending school. Nevertheless
it seems logical to suppose that most of a school child’s friends will
be found among his schoolmates. For this reason we can look to the percentages
in the public schools with added interest. In these schools both Indian and white
pupils were attending although not usually in equal proportions.
In the Phoenix Area the number of public school pupils was small, with the ratio
of white pupils to Indian pupils in most grades running two or three to one.
Still, about three-fourths of the Indian pupils said their friends were all or
mostly Indian; about 90 percent of the white pupils said their friends were all
or mostly white.
In the Albuquerque Area the average ratio of white pupils to Indian pupils in
public schools was approximately eight to one. In spite of this, except in grades
four, five, and six. more than three-fourths of the Indian pupils said that all
or most of heir friends were Indian. In every grade n-tore than 90 percent
of the white pupils said all or most of their friends were white. This response
by the white pupils is not surprising since there were so few Indian pupils from
whom they could choose their friends.
In public schools of the .Aberdeen Area the ratio of white pupils to Indian pupils
was between three and four to one. Here again a strong majority of the Indian
pupils claimed all or mostly Indian friends while more than 95 percent of the
white pupils said their friends were all or mostly white boys and girls.
Five times as many of the pupils tested in public schools of the Anadarko Area
were white than were Indian. Understandably, in view of the disproportion, not
ti-tore than two percent of the white pupils said that all or most of their friends
were Indian. In the Anadarko Area, however, a majority of the Indian pupils
in grades four, seven, ten, eleven, and twelve said that all or most of their
friends were white. In the other grades the proportion of Indian pupils claiming
all or mostly white friends, while less than half, was substantial.
In general there were between three and four times as many white pupils as Indian
pupils tested in public schools of the Muskogee Area. As expected, more than
95 percent of the white pupils said that all or most of their friends were white.
In all grades except seven and eight, however, a majority of the Indian pupils
said that all or most of their friends were white.
In some ways. the data from the Billings Area are the most revealing. This was
the only one of the six areas in which the numbers of white arid Indian pupils
in the public schools were approximately equal. It is significant, then, that
more than 80 percent of the pupils of each race indicated that all or most of
their friends were of their own race.
It seems fair to conclude that, except in the, Oklahoma Areas, Indian pupils
choose their friends mainly from their own race even though they have an equal
or larger number of white schoolmates from whom to choose. And in the public
schools of the Billings Area. where the proportion of white and Indian pupils
was equal. the white pupils were equally inclined to select their friends from
their own race.
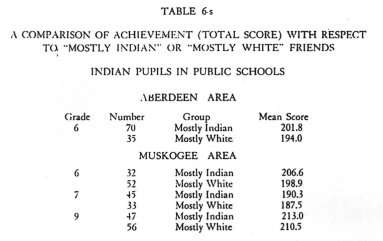
The Relationship Between Choice of Friends and Achievement
An attempt was made to compare the school achievement of Indian pupils who said
that all or most of their friends were white children with those who said they
had all or mostly Indian friends. The attempt was not very rewarding. Because
of insufficient numbers of Indian pupils claiming all or mostly white friends,
comparisons were possible only for Indian pupils in public schools in the sixth
grade of the Aberdeen Area and in grades six, seven, and nine of the Muskogee
Area. Table 6-s shows the results of these Comparisons. None of the differences
in mean total score was found to be statistically significant. On the basis
of these findings there is not sufficient evidence for accepting the hypothesis
that Indian pupils who has e mainly white friends achieve better in school than
those who do not.
There is no reason for concluding from the data that Indian children do not achieve
better by reason of attending school with white children. The data do not bear
upon that point. It must be remembered that the question concerned “friends”—not
associates or schoolmates. Few of us consider every associate a “friend” in
the close, intimate connotation that the term usually carries. One may be able
to learn from associates without feeling that they are close friends.
What is revealing is the evidence that the integration of the children of two
races in a school in the bare sense of attendance does not necessarily lead.
Immediately at least, to a type of social integration which will cause pupils
to choose their friends without regard to race.
THE PROPORTION OF WHITE PUPILS IN THE SCHOOLS ATTENDED BY INDIAN PUPILS
An investigation was made of the school achievement of Indian pupils in relation
to the proportion of white pupils in the schools they attended. The background
data for each pupil indicated whether the school he attended was made up of:
1. only Indians; 2. mostly Indians; 3. halt Indians. halt whites: 4, mostly whites:
5, only whites. In treating the data. 1 and 2, above were combined and designated
as mostly Indian” and 4 and 5 were combined and designated as “mostly
white.”
Obviously there were no Federal or mission schools which enrolled “mostly
whites” or even “half Indian, half white” since the main reason
for the existence of such schools is the education of Indian youth. Consequently
such comparisons as could be made were entirely of Indian pupils attending
public schools . All public schools in the study enrolled some Indian pupils
else they would not have been included. In some of these schools most of the
pupils were Indian. .As usual, a minimum requirement of thirty pupils in a category
was adhered to before comparisons were made.
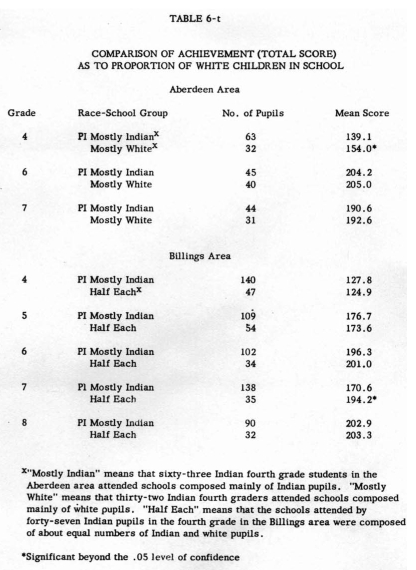
on the average on total score than
those attending “mostly Indian” schools. Differences in grades six
and seven were in the direction of the pupils attending “mostly white” schools
but they did not differ significantly.
In the Billings Area comparisons were made in grades four through eight between
the average achievement of Indian pupils attending public schools which were “mostly
Indian” and that of pupils attending schools that were ‘half Indian,
half white.” Only one of these differences was found to be statistically
significant. This was in grade seven iii which the pupils attending schools which
were “half Indian, halt white” scored higher on the average than
those in the “mostly Indian” schools. In grades tour and five the
differences, although in the direction of the “mostly Indian” schools,
were not significant.
In all, the data are not very impressive. There is a slight indication that Indian
pupils attending public schools enrolling a large proportion of white pupils
achieve better than those attending public schools with mostly Indian pupils
but the evidence is by no means conclusive. Combining the probabilities yields
a result lower than that which statisticians usually require before attaching
significance to a difference.
REGULARITY OF ATTENDANCE
To most persons, and certainly to most teachers, it has been a foregone conclusion
that regular attendance in school is an essential ingredient in a pupils scholastic
success. To these persons it may seem a waste of time and effort to investigate
the relationship between school achievement and regularity of attendance. The
investigators were interested in bringing objective data to bear upon this question,
however, for precisely the reason that it is so seldom done. The data do show
clearly that, in general, pupils who attend school regularly learn more in the
basic skills measured than those who do not. The evidence is remarkable
mainly in that it is not more conclusive than it is.
The investigation concerning regularity of school attendance was confined to
the day schools of the Aberdeen Area. distances are great in North Dakota and
South Dakota and the winters are long and hard. Roads and weather often conspire
against a child’s getting to school in the morning. In addition, many of
the Indian people in this area engage in seasonal labor of the migrant type which
takes them away from their homes, particularly in the early weeks of the school
year. It was felt that hoarding schools do not encounter attendance problems
to the same degree as do day schools.
Table 6-u shows the relationship between regularity of attendance and school
achievement in the day schools of the Aberdeen Area. The data are shown by grades
and by race-school groups. These are subdivided, further, into two groups on
the basis of regularity of attendance and a comparison made of their mean
total score on the test battery. A distribution was made of the number of days
of absence for each separate race-school group within a grade and the median
number of days absence for the group was computed. This resulted, of course,
in au approximately equal division of each group. For example, for Indian pupils
in Federal schools in grade four, the median number of days of absence per pupil
was between fifteen and sixteen. A comparison was then made of the average achievement
of those pupils who missed fifteen days of school or less with that of those
who missed sixteen days of school or more. The mean difference was bound to be
4.6 raw score points. This difference, taken by itself, was not statistically
significant.
In all, eighteen separate comparisons were possible. holding to the requirement
of not less than thirty pupils in a group. Of these, four were statistically
significant. It is noteworthy. however, that sixteen of the eighteen differences
were in the direction of the more regular attenders. Neither of the two differences
which were in the direction of the irregular attenders was statistically significant
. A combining of probabilities of the eighteen differences reveals that, in general,
the superiority of achievement of regular attenders over irregular attenders
is highly significant. Nevertheless, the margin of superiority of irregular
attenders
over those who were more regular. among seventh-grade
Indian pupils attending public schools, may prove surprising to many readers.
It should be said that this was the smallest of all the groups with exactly thirty
pupils in each category. Differences within the group, of factors other than
attendance, apparently overcame the tendency of regular attenders to achieve
higher than those who were irregular.
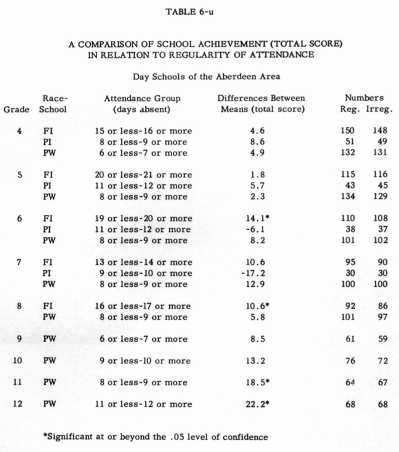
It will be noted that the greatest absence was among Indian pupils attending
Federal schools, the next greatest among Indian pupils attending public
schools id the least among white pupils attending public schools. This is not
surprising since, as was pointed out earlier in this chapter, the Federal schools
serve the less acculturated, and presumable the more isolated portion of the
Indian population. Since the mission schools in the Aberdeen Area are mainly
of the boarding type. no comparisons involving mission school pupils were possible.
It is recognized that, whereas the attendance data for each pupil was gathered
for only one school year, every year of the pupil’s school experience up
to the time of testing had influenced his achievement test scores. It seems reasonable
to suppose, however, that. having prolonged illness or other unusual circumstances,
the pattern of attendance of most pupils is probably fairly consistent from year
to year.
Finally, it must he borne in mind that regularity of attendance is only one of
many variables which influence learning. The data give us no reason to doubt
that, it all other variables could be held constant, pupils who attend school
regularly would achieve consistently better than those who do not.
EDUCATIONAL ASPIRATION
The investigation revealed a striking and highly significant
relationship between the educational aspiration of pupils and their school
achievement. The evidence is rather overwhelming that, in general, the higher
achieving
pupils expect to go farther in school than do the low achievers. The evidence
does not reveal which is cause and which is effect, if we assume that a cause
and effect relationship exists. That is, we do not know whether pupils aspire
to continue in school because they learn well or whether they learn well because
their aspiration is high. Perhaps each contributes in some part to the result.
All we know is that high aspiration and high achievement tend to go together.
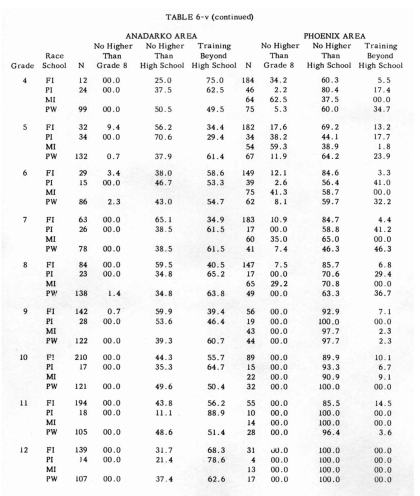
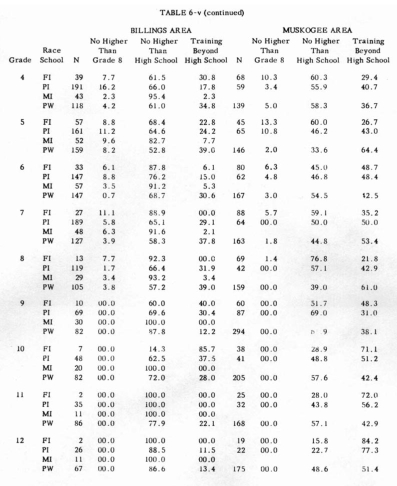
All pupils tested were asked to indicate how far they expected to go in school.
Table 6-v shows the numbers of pupils responding. by areas, grades and race-school
groups. It also shows the percentages of pupils in each of three categories:
1. those expecting to go farther in school than grade eight; 2. those expecting
to go beyond grade eight but no farther than graduation from high school:
3. those expecting to take some kind of training beyond high school. This
latter did not has e to lie college. but could lie nurses’ training or
some sort of trade or business training.
These tables of percentages are shown because it is believed that they will be
of interest to many readers. The great preponderance of even fourth. fifth,
and six-grade pupils, regardless of area or race-school group expected to get
at least sonic high school training. In general, a larger proportion of the pupils
of both races in the Oklahoma areas expected to secure training of some sort
beyond high school than wa5 true for pupils of the other areas.
In most of the areas there is a slight. but not a consistent tendency for a greater
proportion of white pupils than Indian in the elementary and intermediate
grades to aspire to education beyond high school. This proportion is likely to
reverse itself in the eleventh and twelfth-grades, however.
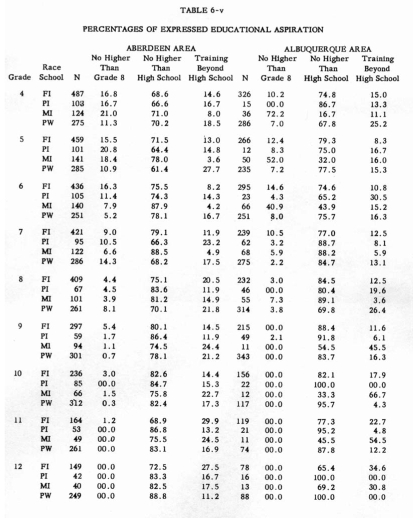
It may be observed that in some of the areas a scattered few pupils who were
in the high school grades indicated that they did not expect to go beyond the
eighth grade, Obviously this resulted from their misunderstanding the question
or inadvertently marking in the wrong space.
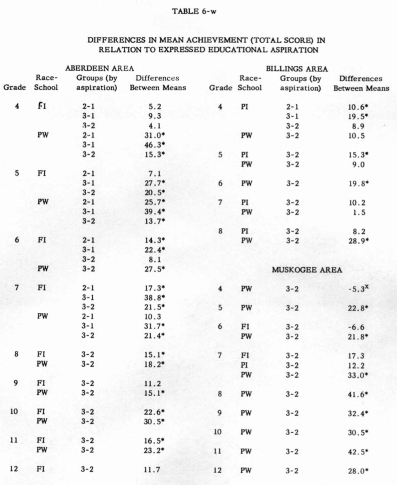
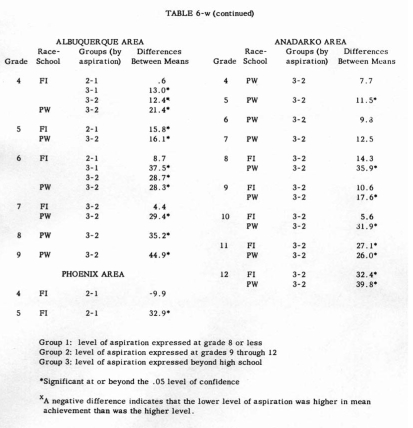
Table 6-w shows comparisons of the average achievement (total score) of the three
groups as defined by level of aspiration. These are shown by areas, grades. and
race-school groups. Comparisons, as usual, were confined to those groups having
thirty or more pupils. In all, eighty-three separate comparisons were possible.
Of these, all but three showed the higher aspiring group to have the higher mean
achievement score. Of these eighty differences favorable to the higher aspiring
groups, fifty-five were statistically significant. Of the three differences favorable
to the lower aspiring groups, none was statistically significant.
It was noted that of thirty-three comparisons involving Indian pupils in Federal
schools, seventeen or slightly more than half were statistically significant.
Of those involving white pupils in public schools, thirty-five of forty-three,
or slightly more than 80 percent were significant. Three of seven differences
involving Indian pupils in public schools were found to be significant. No comparisons
invoking Indian pupils attending mission schools were possible because of insufficient
numbers. There was a tendency for the differences between groups of white pupils
to be larger than was true of Indian pupils.
It is of special interest to note that even at the fourth-grade level the relationship
between educational aspiration and achievement had begun to manifest itself.
1 “The Effect of Pre-School Language on the Educational Achievement
of Indian and White Children in the Southwestern United States” a progress
report submitted by the university of Kansas to the Bureau of Indian Affairs,
January 1954.
2 Shalier Peterson, 1948, “Hos Well Are Indian Children
Educated”: Haskell Institute Press.
3 Kenneth E. Anderson, E. Gordon Collister
and Carl F. Ladd, 1954: “The
Educational
Achievement of Indian Children:” Haskell Institute Press.
4 Statistical Abstract of the United States, Bureau of the
Census, 1950.
5 R. A. Fisher, 1950, “Combining Tests of Significance,” Statistical
Methods for Research Workers, New York: Hafner, pp. 99 – 101.
|