The Indian Child Goes To School
CHAPTER VII
THE USE OF TEST RESULTS FOR PUPIL
GUIDANCE AND THE IMPROVEMENT OF INSTRUCTION
In Chapter II the use of achievement test results
for pupil guidance and improvement of instruction, at the classroom
level, was described
as being among the purposes of the testing program as envisioned
at the very outset. In this chapter the manner in which this purpose
was implemented will be described.
Since the inception of the educational testing movement, less than
fifty years ago, down to the present day, many teachers have confused
the giving and scoring of achievement tests and the recording
and inspection of the results with having an actual testing program.
In many quarters the giving of tests has been considered the ‘thing
to do.” If a testing program includes nothing more than the
elements listed above, it scarcely is worth doing at all. The interpretation
and analysis of tests results in a professional manner, so that
they will throw helpful light on the real problems of education,
is admittedly the difficult part of the testing process.
The University of Kansas and the Evaluation Office of the Education
Branch of the Bureau of Indian Affairs early committed themselves
to the task of developing for the cooperating schools interpretive
devices and techniques, consistent with the most advanced practices
in educational measurement, and teaching school personnel how to
use them.
THE NEED FOR AREA NORMS
In Chapter III the differences in level of achievement among the
several administrative areas of the Bureau of Indian Affairs
have been demonstrated, It has also been shown that these areas
differ markedly from each other with respect to certain cultural
factors. For these reasons it was considered best to establish
for each area a set of separate or differentiated norms, based
on the achievement of the pupils of that particular area.
Since it is always necessary, in evaluating test results, to have
some sort of norm available as a standard of comparison, the
alternative to an “area” norm would have to he the
published norms of the California Achievement Test, commonly referred
to as a “national” norm. These norms are expressed
as percentile ranks or grade or age equivalents. Of these, the
one in most widespread use is undoubtedly the grade equivalent.
The reasons for this are readily understandable. Teachers are -accustomed
to thinking of pupils in terms of grade levels. If, for instance,
a pupil gets a total of 230 items correct on the elementary battery
of the California Achievement Test, he is, presumably, achieving
at the 0.2 grade level; i.e., the second month of the sixth grade.
All of this is beguilingly simple and comprehensible. It is only
when one begins to make a more critical approach to the concept
of a ‘‘national norm, expressed in grade equivalent
values, that certain danger signals come into locus.
The primary danger is that of accepting a grade equivalent score
as an absolute value rather than a relative one. Each test maker
standardizes his test on a population of pupils of his own choosing.
It is true that he tries, usually, to make his sampling of pupils
representative of the pupils of the entire country. But his
population of pupils will differ from that of another equally reputable
test-maker in point of numbers, location of residence, cultural
factors, and in many other ways. Resides this, the two tests are
different from each other. As a result, if the pupil is given two
different achievement tests at approximately the same time, he
will probably conic out with differing grade equivalent values
and sometimes these variations are astonishingly wide.1 Who is to
say which, if either, is his “true” grade equivalent
score?
If. however, we do accept the principle of the “national” norm,
it is of dubious help in specific educational situations. The “normal” child,
on a national scale, is a mythical creature. Because of the cultural
influences involved we have no right to expect that the Apache
child, for example, will achieve in the same way as the child of
the Philadelphia lawyer, or the Detroit automobile worker, or the
Dakota wheat farmer, or the Hollywood movie star. Nor does it help
very much to roll them all up into one and claim that the composite
result is typical of the country as a whole, It is true that by
setting up area norms we have not eliminated cultural factors,
hut by confining our populations to rural children from the same
general localities we have certainly minimized them.
Another pitfall of conventional grade equivalent norm tables is
what has been described as “false precision” of
measurement. If, for example, a fourth-grade pupil gets one item
correct on the arithmetic reasoning section of the elementary battery
of the California Achievement Test, he is said to be achieving
at the 1.7 grade level, hut if he gets two items correct we are
told that he is achieving at the 2.1 grade level. This is a difference
of .4, or nearly half, of a grade. Since there are forty-five items
in this section of the test and thc items are of the multiple choice
type, it must be perfectly evident that the difference between
one and two items could have occurred by chance and very likely
did. Too often this elemental fact is not stressed with the teacher
when she is encouraged to use grade equivalent norms.
Desirable as differentiated norms are, however, they are not often
available. The establishment of satisfactory norms is a task calling
for an expenditure of considerable time and money, the possession
of some specialized equipment, and a great deal of professional
skill. The University of Kansas, during the period 1951-55, developed
six such sets of norms for the Bureau of Indian Affairs, in fall
testing programs, and a set of spring testing norms (for the Albuquerque
Area).
INTERPRETING THE TEST RESULTS
The California Achievement Tests
The California Achievement Tests are designed to measure achievement
in six basic skills: reading vocabulary, reading comprehension,
arithmetic reasoning, arithmetic fundamentals, mechanics of
English and grammar, and spelling. The six part scores when added
together yield a total score. The test is published in four levels:
primary for grades 1, 2, 3, amid low 4; elementary for grades 4,
5, and 6; intermediate for grades 7, 8, and 9; and advanced
for grades 10, 11, and 12. Since testing in this program started
with grade four, the primary level was not used. The tests at the
different levels contain entirely different items and are, of course,
progressively more difficult.
The Area Norms
The University, then, constructed separate norms for each level
of the test, and for each grade within each level, for each of
the six areas, The sole exception to thus was in Oklahoma where
no statistical difference was found between the achievement of
tenth. eleventh, and twelfth grade students in the Anadarko and
Muskogee Areas and they were combined into one norm group.
The Interpretive Devices
The Profile Sheet. A profile sheet was constructed
for each level of the test for each area. A profile sheet is simply
a graphic
method of presenting a pupil’s test scores in order that
certain comparisons can lie made and certain judgments reached.
These profile
sheets were reproduced in sufficient quantity to
provide the schools with one for each pupil tested.
The m material which follows in this chapter is set forth much
as it was presented to supervisors and teachers in the field as
a part of an in-service training program.
Figure VII-I is a picture of a profile sheet. It and the other
devices illustrated in this chapter are specific to one of the
six areas but they are illustrative only and do not differ in principle
from the materials developed for the other areas. The profile sheet
shown Figure VIII is for the elementary level of the California
Achievement Tests and is based on 1,585 pupils in grades 4, 5,
amid 6.
The seven columns representing the several skills and total score
show distributions of raw scores. A ‘‘raw” score
in this case means simply the number of items a pupil answered
correctly. Taken by themselves raw scores have no meaning. If a
pupil gets thirty items right on the reading vocabulary test we
do not know whether this is good, had, or mediocre. That judgement
will have to lie made in relation to what other pupils do on the
test. Raw scores cannot he compared directly. Thirty items would
lie one-third of the itch15 on the vocabulary section, for example,
hut they would include all of the words iii the spelling section
and thus would be a perfect score.
Consequently, we must put raw scores into some frame of reference
if they are to have meaning. This has been done by transforming
the raw score distributions to a normalized T-score scale.
This scale is shown at the sides of the profile sheet. The heavy
black line, running across the middle of the page from a T-score
of 50, represents the median, or average, achievement for the combined
group of fourth, fifth, and sixth-grade pupils. The lines running
from T-scores of 60 and 40 represent, respectively, achievement
one standard deviation above and one standard deviation below the
average. Even though the teacher is not familiar with this statistical
terminology it can take on real meaning for her very quickly
when she is told that the test scores of about two-thirds of the
pupils i if the area fall between T-scores of 60 and 40. Approximately
one-sixth of the pupils will he above a T-score of 60 and about
the same number below a T-score of 40.
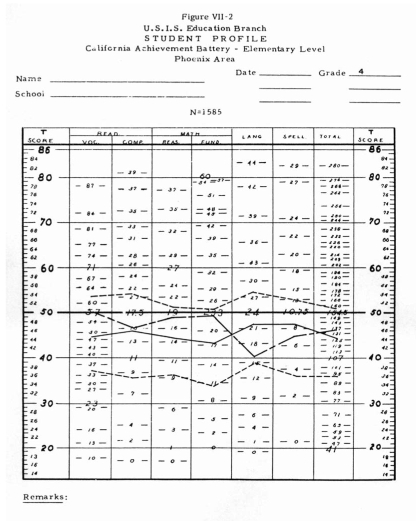
The Grade Norm Overlay. The teacher, of course, is interested in
comparing the achievement of her pupil not only in relation to
the level of the test, but also with reference to the achievement
of other children of the same grade. Figure VII-2 shows how this
nerd has been provided for. The four lines shown on thus profile
in reality arc derived from two separate sheets of material. One
line represents the same fourth-grade scores of the pupil whose
scores for the fourth, fifth, and sixth grades were shown in Figure
VII- I. It is the profile with a single dash between the score
points, running from a score of ~7 in reading vocabulary to a score
of 137 for the total test. The other three lines are obtained from
a sheet of transparent cellulose acetate on which the lines are
drawn. In practice the transparency is placed over the profile
sheet and correctly fitted into it. It is then called an “overlay.” The
solid middle line of these three shows mean achievement for grade
four. Thc broken lines above and below the mean line represent
plus and minus one standard deviation, respectively, from the mean.
The figure illustrates what the user of these devices sees when
he properly registers a fourth-grade overlay on a fourth-grade
profile.
Describing Levels of Achievement, Now we are in a position to assign
descriptive adjectives to achievement. If a pupil’s score
falls above the top broken line it lies iii the top one-sixth of
the norm group amid may he called “superior.’’ If
it falls between the solid middle line and the top broken
line it nay be characterized as ‘‘high average’’;
if between the middle line and the bottom broken line, as ‘‘low
average.’’ Each of these segments represents about
one-third of the norm group. If the score falls below the bottom
broken line. it will be in the lowest one-sixth of the norm group
and may be called2 “low.”
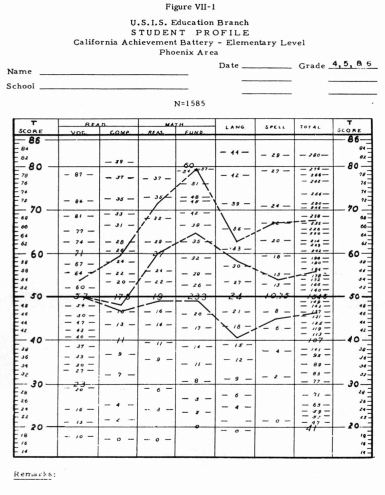
Plotting the Student Profile. Let us look again at Figure VII-1.
Here we see the achievement profile of an actual pupil (anonymous
but real) for three consecutive years: grades 4, 5, and 6. The
pupil’s raw scores were plotted by finding the appropriate
score in the proper column and marking it in the middle of the
column. If the pupil’s score is riot. actually shown in the
column, the distance should be divided, proportionately, between
the scores on each side of his. After the points were plotted they
were connected with straight lines, Teachers were encouraged to
use different colors in profiling scores for different years.
Making Useful Comparisons. What comparisons can we now make that
will permit judgments helpful in the guidance of the pupil? These
comparisons are mainly of three types. First is the comparison
of the scores of one pupil with those of another. This we may call
an “inter-individual” comparison. This is probably
the least common use of test scores. Second is the comparison of
a pupil’s achievement in one skill with his own achievement
in a different skill. This we will call an “intra-individual” comparison.
This technique may be very useful and important. By this means
a teacher may learn the specific strengths and weaknesses of a
pupil. Is John better in reading comprehension than he is in arithmetic
fundamentals? The answer to this question may have much to do with
the placing of teaching emphasis, the planning of remedial work,
or the selection of learning materials for John. Third is a comparison
of the pupil’s scores with those of the group of which he
is a member. This is probably the most common use of test scores
and we will call these “individual-group” comparisons.
1. Using a Grade Norm. Let us illustrate the suggested uses by
studying Figure VlI-2 for a moment.,. We note that as a fourth-grader
this pupil’s achievement was largely at the high average
level by comparison with other fourth-graders of his area; i.e.,
between the mean and one standard deviation above. He was not superior
in any skill. In language he was well down in the low average level
and in spelling he was very close to the mean line. His scores
seem fairly consistent except for his performance in language.
How can we be stare, though, that he was really poorer in language
than in some of the other skills? He seems to have been somewhat
lower in reading comprehension than in reading vocabulary. Is this
enough of a difference that we should attach any importance to
it?
2. Making Allowance for Error in Measurement. It will be remembered
that earlier a complaint was lodged against grade equivalent scores
because of what was called “false precision” in measurement
and it was shown that some differences occur purely by chance.
It is important to make allowance for this and not to assume that
every difference between scores, however minute, is significant.
A statistical analysis of the several profile sheets constructed
showed that the number of T-scores of difference necessary to be
significant at the 5 percent level of confidence ranged between
seven and nine. It seemed that a workable “rule of thumb” would
require eight T-scores of difference between pairs of scores before
a difference would he considered significant. (See Appendix D.)
Then, in other words, only five times in a hundred would a difference
this large or larger have occurred by chance alone.
3. Applying the Test of Significance. Applying the “rule
of thumb” stated above to Figure VII-2, we see that there
is really no significant difference between the two fourth-grade
reading scores. In fact, we cannot be sure that any of the scores
are different from each other, except that language is definitely
lower than reading vocabulary and both of the arithmetic scores.
4. Measuring Growth as well as Status. So far we have commented
only upon the pupil’s status of achievement at a given time.
As noted before, however, in Figure VII- I his achievement for
three consecutive grades is profiled. This enables us to study
his growth in learning over this period of time and is one of the
most helpful of all uses of test results. Recently the teaching
profession has become much more aware of the value of this function
of testing. If we are sincere in our acceptance of the educational
axiom that “we must accept the child where we find him,” then
necessarily we must be more concerned about his development than
about the status of his achievement at any one point in time.
There is abundant evidence that the pupil in Figure II-i is learning
but that he is not learning equally well in all the skills. Obviously,
reading vocabulary
is his weakest spot so far as development at these grade levels is concerned.
He showed no growth in that skill between grades four and five and no significant
growth between grades five and six. His gain in reading comprehension between
grades four and five was not significant, but it was significant between grades
five and six. His gains in both arithmetic skills were large and significant
between all grade levels and it is apparent that his learning in arithmetic is
out stripping that in the other skills. His growth in language was very large
between grades four and five but was not significant between grades five and
six. His growth in both spelling and total score was significantly large between
all grade levels.
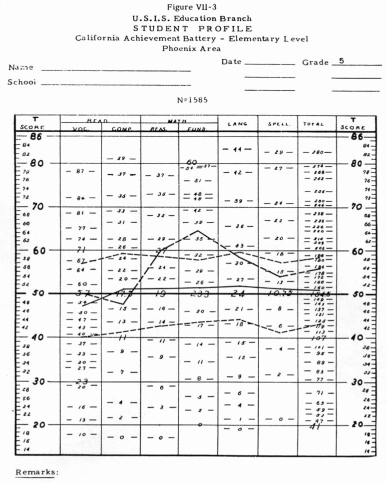
5. Using the Sequence of grade Norms. When we use the fifth grade norm on the
same profile, as in Figure Vll-3, we see that, whereas the pupil was “high
average” in both reading skills at the fourth-grade level, as a fifth-grader
he was exactly at the average line in reading vocabulary and had slipped into
the “low average” in reading comprehension, in the arithmetic
skills, however, he had moved up into the superior level. His language achievement
had moved up from low average to high average and his spelling score, which was
at the average line in grade four, was high average in grade five. His total
score maintained its position at the high average level.
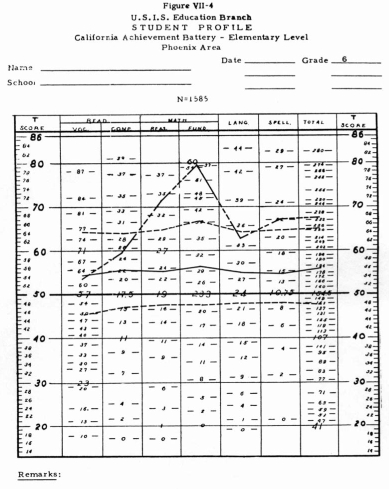
In Figure VIl-4 the sixth grade norm is shown on the same profile sheet. We now
observe that the pupil is definitely at the superior level in the two arithmetic
skills and is particularly high in arithmetic fundamentals. He is at the superior
level also in spelling and total score. He is at the high average level in language
and reading comprehension Only in reading vocabulary is he slightly below the
average line for sixth-grade pupils. Only in reading vocabulary and language
was his growth between grades five and six so small that there is doubt about
its significance.
When one compares Figure Vli-2 with Figure VII-4 it becomes apparent that the
growth of this pupil over the three-grade span has been much greater than normal.
Whereas he was only slightly above average as a beginning fourth-grader,
he is generally at the superior level as a beginning sixth-grader. Obviously
this pupil has rather high capacity for learning. His achievement in arithmetic,
however, is outrunning his learning in the language skills and his growth
in reading vocabulary, even over the span of three grades, has not been significant.
It will be seen that in order to make judgments of this kind concerning
pupil growth it is necessary to administer the tests at approximately the same
time each year in order to get a measure of one year’s growth. Also, since
the norms were established on data obtained in the fall of the year, it is necessary
to continue giving the tests in the fall. There is no evidence that pupil growth
continues at an even pace throughout all parts of the school year.
Factors Influencing Learning
It should be noted that the test scores and the use of the profiles and grade
norms tell us only what is true and not why it is true. In order to make judgments
concerning the causes of differences we need to utilize other information about
the pupil to which we may have access.
For instance, it might be suggested that the pupil in our example is learning
faster in arithmetic than in reading because arithmetic is being taught better
or that more emphasis is being placed upon it. It becomes important to know,
then, that this pupil had three different teachers in the three different grades
and if the above theory is correct it is true of at least two of the three teachers
rather than only one.
It is also illuminating to know that this pupil comes from a non-English-speaking
home where the child has scant opportunity to speak English and is not encouraged
to do so. Manifestly most of his vocabulary building must be done at school.
In this respect he differs from most children in America and from most of the
non-Indian children, and many of the Indian children in his own area who develop
vocabulary skills outside
of school as well as in.
We have inferred already that this pupil has a high learning potential. It
seems quite reasonable to suppose that he is compensating for his difficulties
in acquiring
vocabulary and other verbal skills by applying, his abilities with special
zeal to learning the arithmetic skills. In the latter field he is not so
much at a disadvantage with children from English-speaking homes, since
most children learn the greater part of their arithmetic skills in school.
If these latter theories are correct, then it becomes apparent that the school
has
a special obligation to enrich this pupil’s language opportunities by
every means at its command.
The above material has not been offered as a definitive treatment of the use
of the interpretive devices, but has been intended as illustrative only.
The resourceful and interested teacher will find many ways to use them to her
arid the pupil’s advantage. Achievement needs to be considered in the light
of mental ability, motivation, emotional adjustment, teaching emphasis,, and
learning opportunity.
Perhaps with respect to his ability a pupil is doing very well, although his
scores are not high; or perhaps he should he doing much better. Need for remedial
work may be indicated for some pupils in certain learning areas. The test
results may be useful in the grade placement of pupils and in ability grouping,
if this is consistent with school policy.
An Additional Device for Interpretation
Until lately it has not been possible to study pupil growth between grades six
and seven and grades nine and ten because of the changes of test batteries at
those grade levels. Recently, however, a satisfactory method has been devised
for converting scores of the intermediate battery into equivalent elementary
level scores, and vice versa, and the same thing can he done as between the intermediate
and advanced levels.3 This will make possible a continuous evaluation of pupil
growth from grade four through grade twelve. Those interested in using the
method are referred to Pupil Test Score Differences in the Phoenix Area by Dr.
Carl E. Ladd, available from the Education Branch of the Bureau of Indian Affairs.
Use in Group Evaluation
The profiles and grade norms may also be used in evaluating the progress of groups
ot pupils.4 The material presented hereinafter is taken from a model study done
on a selected day school operated by the l3ureau of Indian Affairs. It represents
twenty-three pupils who were tested in the fourth grade in the fall of 1951 and
who progressed to the fifth grade in the same school and were tested a year later
in 1952. Twenty of the same pupils advanced to the sixth grade in 1953 and were
again tested in the fall of that year. No selection of pupils was exercised
and the group here presented comprised the entire grade, except for those pupils
who transferred or dropped out. The scores of the individual pupils were averaged
together.
Figure VII-5 is a profile of these mean scores for grades four, five, and six.
It will be observed that what was true o the achievement of the individual pupil
discussed earlier, who was a member of this group, is more or less true of the
group as a whole. Greater gains were made in the arithmetic skills between grades
four and six than in the verbal skills.
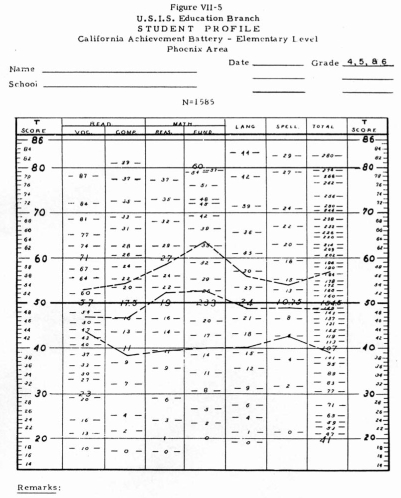
Growth in reading vocabulary, particularly, seems to lag behind that in the other
skills. The growth in arithmetic fundamentals is especially large. One must be
impressed, however, by the fact that this group showed significant growth in
every skill each year. A test of significance showed that in every instance
the differences were significant beyond the .01 level of confidence. That is
to say that the probability was less than one in a hundred that the difference
occurred by chance alone.
In Table 7-a5 the growth between grades four
and five is shown in terms of T-scores and is compared with the normal differences
between these grades for the area.
Only in reading vocabulary was the gain less than normal. In Table 7-b growth
for the group between grades five and six is shown. At this level their growth
was
normal or greater in every skill and on total score. It will be noted that the
gain even in reading vocabulary was greater than normal between grades five arid
six. It can be hoped that this was a result of teacher awareness of the problem
and increased attention to it.
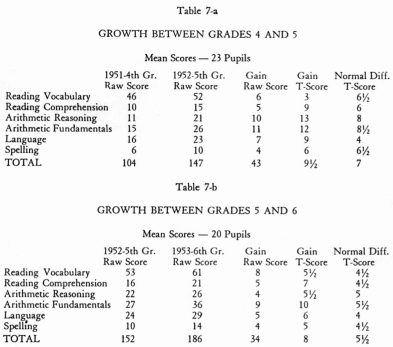
Growth in Terms of National Norms. It is interesting to compute
growth for the same group in terms of the published national norms of the California
Test Bureau.
This is shown in Table 7-c. It will be seen that if judgments for this group
were made only on the basis of national norms it would appear that they had made
normal
progress only in language over the two-year period. On the other hand, when the
area norms are used, as shown in Tables 7-a and 7-b, it can be seen that this
group has equaled or exceeded normal progress in every case, with the single
exception of reading vocabulary between grades four and five.
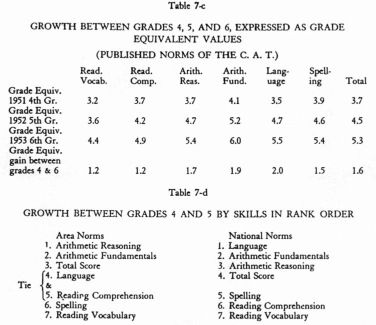
A Comparison of Growth As Measured by Area Norms and National Norms. Arranging
the various parts of the battery and the total score in rank order, first in
terms of area norms and then in terms of national norms, we find the differences
shown in Table 7-d. Here is evidence that area norms and national norms are not
comparable and cannot be used interchangeably.
Determining Levels of Achievement. The stratification of achievement of individuals
by use of the grade means and standard deviations has already been described.
By tallying each of the pupils of a group at the appropriate level and by computing
percentages
for each level, a meaningful comparison is obtained.
Again let us turn to the model study for an illustration of this technique, shown
in Tables 7-e, 7f, and 7-g. These tables deal with total score only. The fourth
and fifth grade groups used were both tested in 1952 and were composed of different
children. The sixth-grade group, however, was tested in 1953 and was composed
for the most part of the same children who were in the fifth-grade group in
1952. In all three
tables all of the children at each grade level were included.
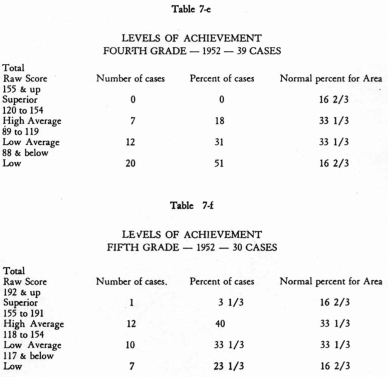
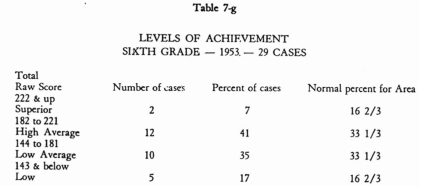
Upon examining Tables 7-c, 7-f, and 7-g, we observe a remarkable upward shift
of achievement level at each successive grade level. Fifty-one percent of the
fourth-graders were concentrated at the lowest level of achievement. There were
no pupils at the superior level. This is not surprising, necessarily, inasmuch
as the reservation is quite isolated and most children speak little English upon
entering school. It is interesting, however, to note the steady reduction of
percentages at the lower achievement levels and the building up of percentages
at the higher achievement levels. Here is unmistakable evidence of growth.
The Program Has Continued
As was said earlier, the foregoing approach, techniques, and materials were used
by the Evaluation Office and the University of Kansas consultants in an in-service
training program for education personnel in the field. All three types of
schools, Federal, public, and Mission, were serviced. It is gratifying to be
able to report that the achievement testing program has been continued along
these
lines by all Federal schools in
the Phoenix, Aberdeen, Billings, Anadarko, and Muskogee Areas and by a good many
of the cooperating public and mission schools.
1 Arthur T. Tait: “A Comparative Study of Five Major
Achievement Tests”.
(Mimeographed report, California Test Bureau).
2 Norm tables stratifying raw scores in this way have been
developed for each area. A sample appears in Appendix D.
3 Carl E. Ladd. The Educational Growty of Indian Children
in the Phoenix Area 1951-1952, as Measured by Test Results (Unpublished
doctoral thesis, University of Kansas, 1955, pp. 255.)
4 Inasmuch as the profile
sheet was designed for use with individuals, primarily,
its use with group data is subject to certain limitations. For example, when
scores are averaged together, the mean scores have greater reliability than
any individual scores. The rule of eight T-score units being necessary for
a significant
difference no longer holds true. Since the number of T-score units necessary
to indicate a significant difference between the means of groups varies with
the size of the group, and the size of classes is not constant, it is impracticable
to calculate this value except for a particular group. It can be said, at least,
that with group scores the allowance does not need to be as large as with individuals.
It also seems safe to say that whenever the difference is at least as large
as the normal difference between the grade means for the area it is not a chance
difference.
5 The T-score gains shown in the tables were easily read
from the elementary profile sheet by consulting the T-score columns on either
side of the sheet. The normal differences between grades were read by superimposing
both the fourth and fifth grade overlays upon the profile sheet simultaneously
and noting the T-score differences between the means (solid black lines). The
same procedure was used with grades five and six in Table 7-b, by using the
fifth and sixth-grade overlays on the profile sheet.
|