The Indian Child Goes To School
CHAPTER VIII
THE PREDICTIVE TESTING
PROGRAM
PURPOSES OF THE PROGRAM
The general
policy controlling educational loans to Indian students is stated
as follows:
“Loans to Indians for educational purposes may be made
only if no other means of financing them is available. Such loans
may be made
by Indian chartered corporations, unincorporated tribes and
bands, and credit associations. The United States, through
the Bureau of Indian Affairs, also may make loans for educational
purposes,
but only to Indians who are not members of a corporation, tribe,
or band which is conducting credit operations, and who are
not eligible for loans from a credit association, unless an exception
iii a particular case is specifically authorized by the Commissioner.
Indians applying for leans from the United States for educational
purposes must be members of tribes which are being served
by existing Area Offices.”1
The specific reference to the use of tests in the granting of educational
loans to Indians is in the following words:
“Except as provided herein, all applicants for educational
loans are required to take prescribed tests obtainable by authorized
school officials from Haskell Institute, Lawrence, Kansas.
Area
or Agency education specialists will arrange for administering
all tests required. At jurisdictions without such personnel,
the Agency Superintendent may delegate a Reservation Principal,
or Teacher, or other qualified employee to administer the
tests strictly in accordance with the instructions accompanying
test papers. Tests may be waived for students who have a high
school
grade average of B-plus or above, or who have completed a
successful term in college.”
“If, in the opinion of the Area Director of Schools,
the applicable high school testing program meets the standards
of the Bureau testing
program, the Bureau tests may be waived, and the official school
record of all results shall be attached to the application.” 2
As was stated in Chapter II, one of the two principal undertakings
of the education evaluation program was the planning and carrying
out of a testing program which would satisfy the requirements of
the provisions quoted above. There were several additional needs
which would be met by such a testing program. First, other types
of scholarship aid, such as working scholarships, grants in aid,
and tribal scholarships, could he more wisely awarded if such test
information was available. Second, Haskell Institute felt the need
for such test data in granting admission to its Commercial Training
Department. Third, even though the student was not seeking financial
assistance, he and his advisors would often welcome such information
as a help in deciding whether a post-high school course of academic
training should be pursued.
The problem with which responsible officials are faced, whether
they be of the Bureau of Indian Affairs or of the various
tribal groups, is to make in advance an intelligent prediction
as to whether a student is likely to succeed in the course which
he wishes to pursue. Available funds are nearly always limited.
Loans must be repaid. Students who lack the requisite aptitude
for advanced academic study, whether in college, nurses’ training,
or a commercial course, often suffer a loss of time and money as
well as frustration and disappointment.
Prediction of success or failure in academic study at the post-high
school level is at best a difficult business since so many variables
constitute the elements of success. Unquestionably, however,
capacity to learn is one of these elements. An intense desire to
succeed and willingness to work long and hard will go far toward
compensating for low scholastic ability, but these diverse traits
do not always’ exist together in the same person and, in
any case, low scholastic ability remains as a negative factor.
Nor is it simple to determine the academic aptitude of a student
for advanced study. High school marks or “grades” provide
a valuable index for this purpose hut they have a serious limitation.
Most schools grade a pupil largely by comparison with his classmates
and with reference to the general achievement level of the school
of which he is a member. This is good educational practice for
intra-school purposes. However, since school and communities differ
widely in educational attainment, pupil performance earning a mark
of “A” in one school may not merit more than a “C” in
another. Nor are achievement test scores ordinarily obtained
in high school entirely satisfactory for predicting post-high school
success. since they are usually related to the achievement of high
school, not college, students.
PLANNING THE PROGRAM
The Test Battery
With the foregoing considerations in mind the conferees who met
at Haskell Institute in December of 1950 agreed that the consultants
at the University of Kansas would recommend a battery of tests
believed to be valid for the purposes described. The Guidance Bureau
of the University of Kansas would stock and distribute this battery,
would score the tests, and report the results. It was also agreed
that validative studies on the battery would be undertaken. It
was further determined that a fifty-cent fee would be required
of applicants taking the battery, partly to help defray the
cost of processing the battery, and partly as evidence of interest
and good faith on the part of the applicant in requesting the tests.3
Early in 1951 Dr. E. Gordon Collistcr proposed the following battery
of tests to Dr. Willard W. Beatty and Mr. Earl C. Intolubbe and
they approved it. (See Appendix E.) The battery:
Otis Quick-Scoring Test of Mental Ability (gamma)
Cooperative English Test (single booklet edition, lower level)
Cooperative General Achievement Test of Proficiency in Mathematics
Hundred-Problem Arithmetic Test (Schorling, Clark, and Potter)
The Guilford-Zimmerman Temperament Survey
The composition of the battery has not changed since it was first
adopted. All of the tests are of the “paper and pencil” type
and may he administered to groups or to individuals.
The Otis test yields a measure of general intelligence or mental
ability expressed as an intelligence quotient. The Cooperative
English Test is in two parts, English and reading. Each of
these is subdivided: the English into mechanics of expression and
effectiveness of expression, and the reading into vocabulary, speed,
and comprehension sub-scores. Thc Cooperative General Mathematics
Test has two parts, terms and interpretations, and also gives a
total score. The Hundred-Problem Arithmetic Test measures skill
in the four basic arithmetic operations and in fractions, decimals,
and percents. It also yields a total score. The Guilford-Zimmerman
Temperament Survey elicits from the individual, by responses to
a series of questions, a description of his own temperament or
personality.
The same battery was to be given to both college, and commercial
course applicants except for the mathematics test. College candidates
were to be required to take the Cooperative Mathematics Test
because it includes some algebraic and geometric material which
the candidate would quite likely encounter in college. Commercial
course applicants were to be given the Hundred-Problem test since
it was felt that bookkeeping and accounting involve arithmetic
skills almost exclusively.
Disseminating Information to the Field
On February 12, 1951, a letter went out from the Evaluation Office
to all Area Directors of Schools advising them, in brief,
of the main decisions reached at the December conference and promising
that more detailed information on the predictive test battery would
be forthcoming shortly. On February 27 this second communication
went forward to the Area Directors of Schools. Copies of these
letters appear in Appendix E. The several Area Directors of Schools
relayed this information to the various agencies and schools under
their jurisdiction and to public and mission schools enrolling
Indian students. They also devised plans for administering the
tests, taking into account the peculiarities of each area situation.
This phase of the testing program was actually launched when the
University of Kansas began sending out batteries on about March
15, 1951.
Ordering and Administering the Battery
As will be noted in the letter of February 27, a form for use by
the applicant in ordering the battery had been devised and
reproduced in quantity. A supply of these was sent to each Area
Director of Schools and he, in turn, distributed them in his respective
area. The batteries were to be ordered directly from the Guidance
Bureau of the University of Kansas. The Guidance Bureau would then
mail the battery directly to the person named by the applicant,
and approved by a school official, as the one taking the responsibility
for administering the tests. This plan has been followed since.
The application form currently in use appears in Appendix E. A
manual of general and specific instructions for test administration
was prepared by the Evaluation Office and a copy is included with
the test battery when the Guidance Bureau ships the battery. As
has been indicated, the tests are actually administered in the
field by qualified school personnel who are under instructions
to follow the directions faithfully.
Processing the Battery
When the applicant has completed the tests, the marked answer sheets
and the other testing materials are returned to the Guidance Bureau.
There the answer sheets are machine scored anti the raw scores
are converted into an l.Q., in the case of the Otis test; and into
centile ranks in the case of the others. The test results are then
recorded on a report sheet designed for the purpose. This report
sheet and the explanation printed on its reverse side are shown
in Figures VIII-l a-id VIII-2 in this chapter. As will he seen
in Figure VIII1, both raw scores and centile ranks are reported,
except that an I.Q. rather than a centile rank is shown in the
case of the Otis test. Six copies of the report are prepared for
each set of scores.
The Number of Students Taking the Battery
As of September 20, 1955, a total of 2,221 Indian students had
applied for and taken the predictive test battery during the five-year
life of the program. This group was almost evenly divided as between
college and commercial applicants, exactly 1,100 being in the former
category and 1,121 in the latter.
Distributing the Reports of Test Data
The Evaluation Office, because of its greater familiarity with
the organizational
structure of the Bureau of Indian Affairs and the persons to
whom test results should be sent, until recently has undertaken
the distribution of the reports of test data. This function has
now been assumed by the Guidance Bureau of the University of
Kansas. One copy is retained by the Guidance Bureau and one copy
is sent to the Director of Schools of the applicant’s area.
A third copy is furnished to the applicant’s agency and
a fourth to the high school from which he is being, or has been,
graduated. A fifth copy is placed in a permanent file in the
Evaluation Office. If the applicant is a candidate for commercial
training at Haskell Institute, a copy is supplied to that school.
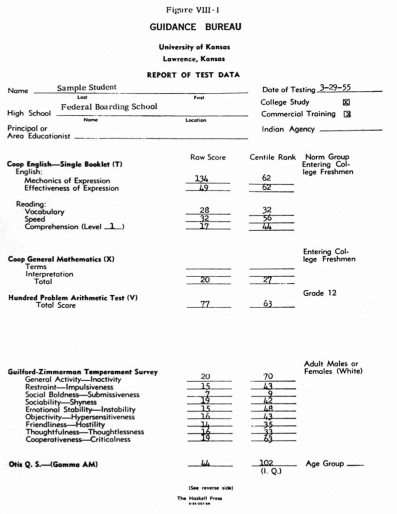
Figure VIII-2
EXPLANATION
The tests named on the face of this report attempt measurement
in areas which are generally agreed to be important to academic
success, namely; use of language, reading, mathematics, temperament,
and mental ability.
Scores are also reported as centile ranks, in relation to the norm
group on which each test was standardized. For example: If
on applicant has a centile rank of 43 in Mechanics of Expression,
we know that his score on this particular test was equal to or
higher than that of 43% of a large group of entering college
freshmen on whom the test was standardized. On the other hand,
57% of this group had scores higher than the applicant’s.
This affords some knowledge of the applicant’s ability in
comparison with other students of the sort with whom, presumably,
he will soon be competing. All centile ranks are interpreted in
this manner. In the case of the Hundred Problem Arithmetic Test,
the norm group is composed of high school seniors; for the Guilford-Zimmerman
Temperament Survey, white adult males and females from the general
population; and for the Otis Mental Ability Testy the appropriate
age group.
The reading comprehension score is reported for one of three levels.
The level depends upon the number of items the applicant attempted.
Level I may be regarded as the slow reading group, Level II as
the average reading group, and Level Ill as the fast reading group.
Centile rank of the applicant in reading comprehension, then,
is based on scores of those students who read at approximately
the same rate he does.
In the case of the Guilford-Zimmermon Temperament Survey, scores
and centile ranks are reported on each of nine different traits.
The higher the centile rank, the greater is the applicant’s
tendency to evaluate himself toward the upper or left hand side
of the scale, as described on the face of this report. The Guilford-Zimmermon
m6nual says. “In most cases the optimal scores do not extend
to the top of the scale, but at some moderate position between
the mean and the top.”
Generally, however, one can predict with more confidence from extremely
high or extremely low scores than from those which lie closer to
the average of the group.
It is hoped that persons making decisions or recommendations affecting
the granting of educational loans, admission to certain courses
of study, etc., will consider data contained in this report as
only a part, but an important and useful part, of the total information
about the applicant which should be considered. School marks; study
and work habits, ability to adjust socially, financial resources,
and the attitude of the applicant and his family toward past high
school education are, of course, some of the other considerations
which must be taken into account.
INTERPRETING THE TEST RESULTS
The reader’s attention is again invited to Figure VIII-l.
The report sheet bears a set of scores actually obtained by a twelfth-grade
student in one of the Federal hoarding schools. They are not necessarily
typical of the scores of other students, but they will serve well
for purposes of illustration, particularly because this applicant
took 1)0th mathematics tests.
The raw scores are important only to Haskell Institute which uses
these in preparing a profile for each of its candidates as will
be explained later in this chapter. The centile rank column provides
the information which is useful in making decisions concerning
college or nursing aspirants. The particular norm group, shown
at the right hand side of the sheet, must he borne ii-. mind however.
The norm groups for the Cooperative English and Cooperative Mathematics
tests are composed of large numbers of entering college freshmen.
Specifically, these college freshmen were enrolled in small
colleges and teachers’ colleges as distinguished from two
other Cooperative norm groups: large private universities and those
of the state university class. It had been observed that the majority
of Indian students attend the smaller schools. The norm group for
the Hundred-Problem Arithmetic Test is made up of twelfth-grade
students and for The Guilford-Zimmerman Temperament Survey
of adult white males and females from the general population.
The l.Q. is derived by comparison with an appropriate age group
from the general population.
An official charged with making a decision or recommendation in
the case of the applicant shown in Figure VIII-l would first read
the explanation printed on the back of the report sheet and shown
in Figure VIII-2. He would then be in a position to make certain
judgments about this applicant’s scores. He would observe
that for the most part the applicant is not very far from
the average of the norm group. On both of the English skills he
is at the sixty-second percentile which means that his scores are
equal to or better than sixty-two percent of entering college freshmen.
Thirty-eight percent have scores better than his. Since nearly
all regularly enrolled college students must take courses in rhetoric
and composition. it is important to know haw this student compares
in English skills with others of the sort with whom, presumably,
he will soon be competing. Apparently our student in Figure VIII-I
compares quite favorably. Proficiency in reading is important to
success in college, for college students are required to do a great
volume of reading and to understand what they read. Our applicant
in Figure VIII-l does not stand quite so favorably in his reading
skills. He is at Level 1 which indicates that he did not attempt
a large number of items. His percentile scores of fifty-six in
speed and forty-four in comprehension indicate. however, that he
is close to the average for those students who read at about his
rate. He is lowest in vocabulary in which sixty-eight percent of
entering college freshmen excel him.
He is higher than only about one-fourth of entering college freshmen
in general mathematics, hut excels nearly two-thirds of high school
seniors in arithmetic skills. This is explainable on the basis
that his high school may not have offered, or he may not have taken,
advanced courses in algebra or geometry. It does not remove the
probability, however, that he will have some difficulty with
college algebra or trigonometry.
On the temperament survey his responses indicate he lacks social
boldness hut is above average in general activity and cooperativeness.
He feels that he is somewhat below average in friendliness and
thoughtfulness, but about average on the other traits.
His obtained I.Q. was 102 which is about average for the general
population hut probably somewhat lower than the average for entering
college freshmen who are, by one means or another, a selected group.
The official might reasonably conclude that the picture is, on
the whole, not a bad one so far as academic aptitude is concerned
and that the applicant merits consideration for some financial
assistance in trying for college education. The scores certainly
do not guarantee his success, but it appears that if other
factors arc favorable this applicant might well succeed in college.
Two points need to be emphasized here. First, comparing the applicant
with a group of entering college freshmen is quite different from
comparing him with his high school classmates who live in the same
community with him. Second, as is stressed in the last paragraph
of the explanation in Figure VIII-2, the test scores are only one
useful part of the total information about the applicant which
is needed to make an intelligent decision.
Both the University of Kansas and the Evaluation Office of the
Bureau have always abstained from making recommendations in individual
cases concerning the granting or denying of loans or admission
to certain courses of study. They have believed their responsibility
to be the furnishing of objective test data, in meaningful form,
to the persons charged with the responsibility for making such
decisions, and, whenever possible, to instruct these persons in
the techniques of interpreting such data.
VALIDATION OF THE PREDICTIVE BATTERY
There has been no opportunity up to this time to conduct any follow-up
study of college loan applicants. Thus, there is no objective
information available which could be used to determine the usefulness
of the test battery in predicting what may be very generally called “success
in college.” A discussion of the ability of the test battery
for predictive purposes must be restricted to the work which
has been done with applicants to, and students of, the Haskell
Commercial Department.4
Selection of a Criterion
In order to predict “success in training” there must
be some measure of success, cornrn)nly called a criterion.
A number of criteria were suggested:
I. Passing a civil service examination in the field of training.
2. Obtaining a position which could not have been obtained without
training.
3. Making average or better grades while in training.
4. Completing training.
School personnel at Haskell Institute desired to make use of the
test battery as early as possible, i.e., for aid in the selection
of commercial students for the school year 1951-52. Consequently,
there was little time available to make an exhaustive follow-up
study of commercial graduates. Such information could have
made the use of the first two criteria possible, but it was not
possible to obtain it in such a short time. The third criterion
of teachers’ grades was recognized as being traditionally
unreliable and so its use as a single criterion was not made.
The criterion of completion of training was used, but in a modified
form as will be explained below.
Early in the spring semester of 1951 the test battery was administered
to students in both years of the commercial course. The training
program was viewed as a selective process in which the poorer students
in this field were gradually weeded out. Thus one might expect
that senior students would score higher than junior students on
most of the tests, especially since they had the advantage
of an extra year of training. Such was not the case. however. The
average score of the forty-four seniors did not differ except within
the limits of chance variation from the average score of the sixty-six
juniors, with but two exceptions: mechanics of English and the
subtraction subtest of the arithmetic test. The seniors scored
higher, on the average, on both of these. Commercial department
teachers agreed that practically all students who successfully
completed the first year of training likewise successfully
completed the second year if they returned to take it. Also, most
of the students who would fail in the training program would have
been dropped by the second semester of the junior year when the
tests were administered. Thus it was felt that for the purpose
of a convenient criterion with this battery of tests successful
completion of the first year of training could be considered equivalent
to successful completion of both years.5 This was not intended
to imply that the senior year in the department provided no increment
in learning for the commercial students. But since the tests in
the battery were not designed to measure the specific objectives
of the Haskell commercial program, they might not reflect any real
differences which could develop in commercial skills between the
seniors and juniors as a result of training.
Validative Studies
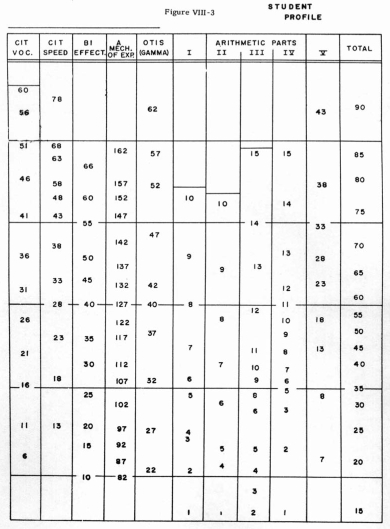
The Original Student Profile. Investigation up to this point left
unanswered questions with regard to how the successful commercial
students differed from unsuccessful ones on their test scores.
In the meantime the battery was being administered to applicants
for admission to the Haskell Commercial Department. A temporary
individual profile sheet, shown as Figure VIII-3, was prepared,
using the score distributions for sixty-seven first-year students.
This profile sheet showed the raw score equivalents for the average
score and plus-and-minus one and two standard deviations from the
mean for the group on each test. The mean line and plus-and-minus
one standard deviation lines for the eighteen lowest achieving
students in the group were drawn on a sheet of transparent acetate
material. The acetate sheet was then superimposed on the profile
and a graphic picture was provided of a candidate’s
performance in relation to the mean of the lowest group of eighteen
students in the first year of the commercial course. Very loosely
this mean line was used as a “cut off line” below which
the prognosis for success of the applicant was not considered good.
No harsh or arbitrary decisions were made on the basis of this
alone. All other information about a candidate was utilized including,
of course, his high school transcript. The technique, which has
been described, was utilized simply as a guidance tool. Some students
whose scores were below the line, were accepted on the basis of
ameliorating information. The commercial staff reported a rather
marked decline the following year both in the number of drop outs
and in the incidence of maladjusted pupils.
The Ferguson Study. An intensive validation study was conducted
by William A. Ferguson in 1952.6 He analyzed the test scores of
applicants to the commercial program for the fall of 1951. He then
compared the results of those who were accepted for that school
year with the results of those who completed the academic year.
There were 187 who took the test battery, of whom 101 were accepted
for admission (although not all of these matriculated), and
fifty-four successfully completed the first year of training.
As a basis for comparison, the frequency distributions for the
tests of all 187 applicants were used. Centile rank equivalents
for each raw score were obtained and raw scores were converted
into normalized standard scores having a mean of 50 and a standard
deviation of 10.
Thus, since the same individuals were administered the entire battery,
the scores on all tests were rendered comparable. To further simplify
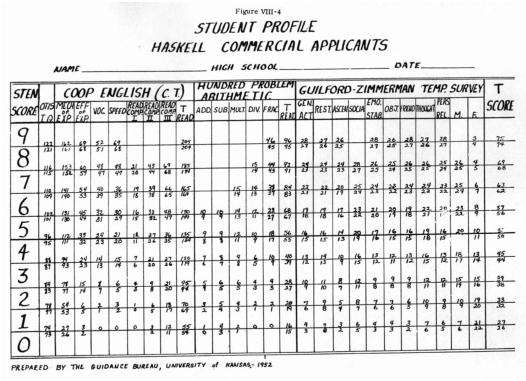
the handling of data on IBM processing machines, and as an aid
in classifying students, a sten scale (standard scale of ten units)
was devised for the normalized distributions. The sten scale ranges
from a low score of 0 to a high score of 9. It has an average score
of 4.5 and a standard deviation of 1.6667 sten score units.7 The
upper and lower raw score limits for each sten score on each test
were found and this information was used in constructing a new
individual profile sheet. This profile sheet is shown as Figure
VIII-4. It was used at Haskell Institute as an aid in selection
for the next two years.
Ferguson compared the average score on each test of 142 applicants
with the average score of forty-five who took the tests but did
not apply for admission. He found statistically significant differences
in favor of the applicants on every test except the Otis Test of
Mental Ability where no difference was obtained. The same procedure
was used to test the differences between the average scores
for the applicants and the average scores for those who successfully
completed the first year of training. For the most part the means
between these two groups were not significantly different. The
average scores on the aptitude and achievement tests were
without exception slightly higher for the successful group than
they were for the accepted group, however. Ferguson concluded that
the lack of differences between the scores of accepted and successful
students indicated that students dropped out of training for
reasons not measured by the battery. But he did develop transparent
acetate overlay sheets eor each of the above two groups, showing
the mean and plus-and-minus one standard deviation from the
mean, so that an individual’s profile could he compared to
them.
Construction of Current Norms. In the spring of 1954 Ralph E. Kron
gathered together all of the test results of Haskell commercial
applicants from the beginning of the program through, March
31, 1954. There were test scores for 566 applicants (408 females
and 158 males) for the battery over the three-year period. The
same procedure that Ferguson used was applied to these data. Raw
score frequency distributions were made, centile ranks were derived,
and a conversion to normalized T-scores was made for each distribution.
The limits of sten scores were then obtained. Inrercorrelations
of the test scores of the 408 females in this population are
shown in Appendix E. Two samples, one of one hundred females
and the other of one hundred males, were drawn at random for a
study of the reliability of these tests for this population.
Appendix E shows the standard error of measurement and the reliability
coefficient for each sex on each test of the battery.
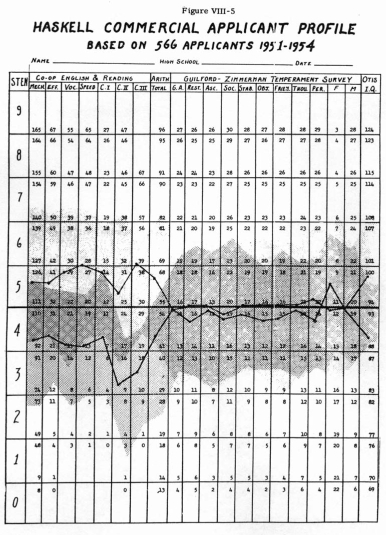
A new individual profile sheet, shown as Figure VllI-5, was constructed,
based or the larger population of applicants for the battery. The
only major format change from Ferguson’s profile sheet was
that only the total arithmetic score was scaled, rather than including
all of the arithmetic subtests in addition to the total score.
An important addition to the usefulness of the profile sheet for
interpretation purposes was made. This was the printing on the
profile sheets of the average profile made by a “pass” group
of 218 students who had completed at least one year of training,
as well as the average profile for a “tail’’ group
of forty-five students. The range of scores between plus-an(1—u1~1nus
one standard deviation from the mean score was shaded in blue
for the pass group and in red for the tail group.
An interesting phenomenon was noted when pass and fail group raw
score points on the tests, for the mean and plus—and-minus
one standard deviation (SI).) from the mean were compared. For
all the tests except The Guilford-Zimmerman scales, the average
score for the pass group approximated the value for plus I S.D.
or the ail group while minus 1 status for the pass group approximated
the average score or the tail group. The profile sheet then appeared
to be fairly neatly divided into fuse levels:
- Scores greater than plus I S.D. of the pass group;
- Scores
greater than the mean of the pass group or plus I S.D. of
the fail group, but less than plus 1 S.D. of the pass group.
- Scores greater than minus 1 S.D. of the pass group or the
mean of the fail group, but less than the mean of the pass
group
or plus 1 S.D. of the fail
group.
- Scores greater than minus 1 S.D. of the fail group but
less than the mean of the fail group or minus 1 S.D. of the
pass group.
- Scores less than minus 1 S:D: of the fail group.
Raw score limits for these five levels were set up. Expectancy tables for passing
and failing were then constructed hi, calculating the percent of those scoring
at each level who either passed or failed. Such tables can be of great use
as an aid in the selection of students who stand the greatest chance for success
in the program. (See Appendix E.)
Several attempts have been made to assign weights to various of thc test scores
in order to increase their ability to discriminate between various criterion
groups. To date none of the weighting procedures has been successful but work
is continuing along this line of research.
Investigation of Personality Traits. A few studies have been made in the Haskell
Institute Commercial Department of the personality factors involved in
success in training there. There were a few differences in temperament traits
between the junior and senior women in the spring of 1951, as measured by The
Guilford-Zimmerman Temperament Survey (GZTS). The junior women scored significantly
higher on the average in the traits of emotional stability, general activity,
and friendliness, and they approached a significantly higher average score
in sociability. Mrs. Louise L. Baker, who was head of the Haskell Institute
Commercial Department for nineteen years, was greatly interested in this phase
of the testing program.8 She found that the median scores on the GZTS of eleven
drop-outs from the 1950-51 program were considerably more in the direction
of hyper-sensitiveness and intolerance than the average scores of students
in the 1951-52 program. The same conclusions were true for fourteen drop-outs
in 1951-52. In addition they seemed to be more submissive, shy, and belligerent.
The twenty-two drop outs for 1952-53 were more impulsive, emotionally unstable,
hypersensitive, and intolerant. Mrs. Baker compared the median scores of eighteen
drop outs and students receiving failing grades with the median scores of the
twenty students who received the earliest job appointments of the 1952 graduating
class. The drop outs were found to be considerably more belligerent, intolerant,
and impulsive than those who received early job appointments. Further study
is now under way in this area in an effort to throw more light on the motivational
factors involved in the drop out problem of students who appear to be qualified
for success in the-program but who do not remain to complete all of the work.
1 Indian Affairs Manual, Vol. IV, Part VII, Chap. 12,
Sec. 1201.
2 Op.Cit. Vol. IV, Part VII, Chap. 12, Sec. 1202.05.
3 In a letter dated February 16, 1953, the Evaluation
Office notified school administrators that the fifty-cent fee would no longer
be
required of applicants for the battery of tests. General dissatisfaction
with the fee requirement had been expressed by school officials. Collecting
the money and transmitting it added to the administrative burden of giving
the tests and slowed down the testing procedure. Early in 1953, upon the
recommendation of the Evaluation Office, the Central Office authorized removal
of the fee requirement.
4 The use of the predictive battery as an aid in selection
before it has been thoroughly validated was clearly seen as a complicating
factor in the validation procedure.
5 E. Gordon Collister, Kenneth E. Anderson and Donald
K. Ottman. “Prediction of Success in the Commercial Program at Haskell
Institute.” Unpublished report, Kansas University, 1951.
6 William A.
Ferguson. “An Analysis of the Test Scores of Applicants to the
Commercial Program at Haskell Institute,” Unpublished master’s
thesis, University of Kansas, 1952.
7 This method of obtaining derived scores was suggested
by Donald K. Ottman. It is a slight revision of the Canfield sten score scale.
Cf. Canfield, A. A. “The ‘Sten’ Scale – A Modified
C Scale,” Educational and Psychological Measurements, XI (1951), Summer,
295-297.
8 Louise L. Baker. “The Testing Program for Selection
of Haskell Commercial Enrollment,” Unpublished report, Haskell Institute
Commercial Department, 1953.
|