The
Educational Achievement of Indian Children
CHAPTER IV
Results of the Statistical
Treatment of the Test Data
INTRODUCTION
The results of the statistical treatment of the test data* obtained
by the administration of twelve tests to the eighth grade and twelve
tests to the twelfth grade will be discussed under three headings:
(1) comparisons of achievement by means of line graphs for the
nine geographic areas and for the six types of schools for grades
eight and twelve, (2) comparisons of achievement by means of the
percentage of overlap between grades eight and twelve where the
tests were common to both grade levels, and (3) comparisons of
achievement by means of critical ratios for the types of schools
for grades eight and twelve. These three types of comparisons were
made in order to provide realistic answers to the basic questions
stated in Chapter II.
Achievement of Indian Children in Various Geographic Areas
A spot check here and there revealed significant differences in
means. This was particularly true of Alaska when compared with
other areas and occasionally true for the Oklahoma, Mountain and
Pacific areas when compared with other areas on both the eighth
and twelfth grade tests. Thus, the reader must make his own judgment
regarding the relative achievement of Indian children in the various
areas, keeping in mind the discussion in Chapter III with regard
to significant differences in achievement.
 Achievement of Indian Children in the Eighth Grade Achievement of Indian Children in the Eighth Grade
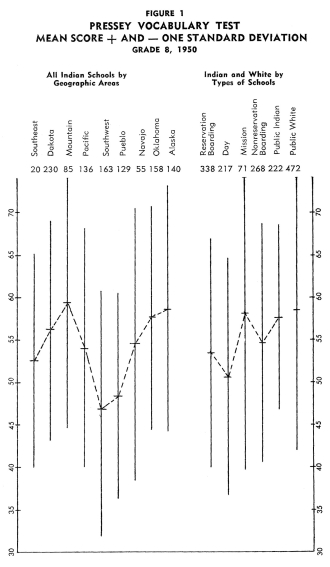
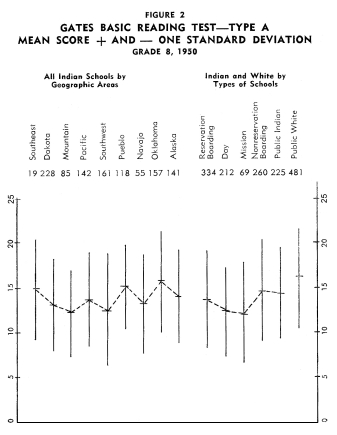
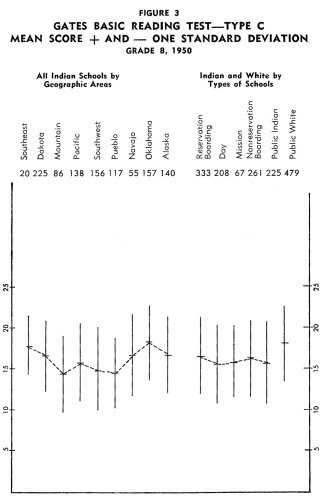
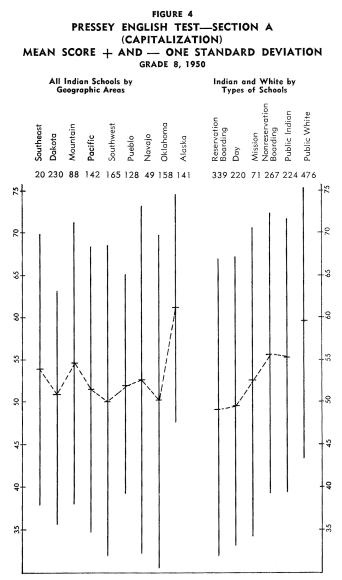
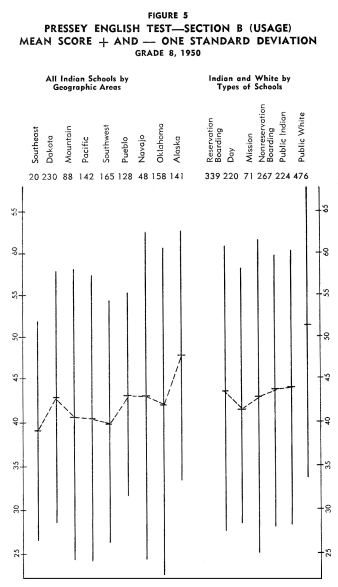
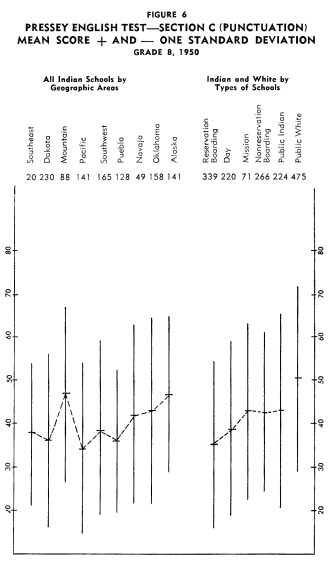
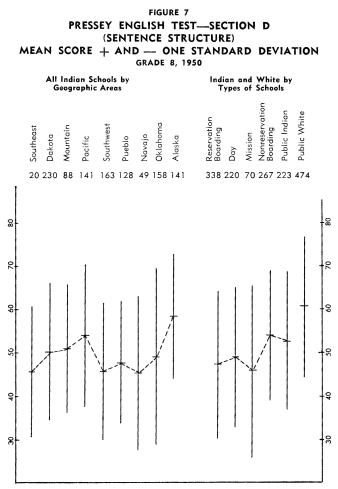
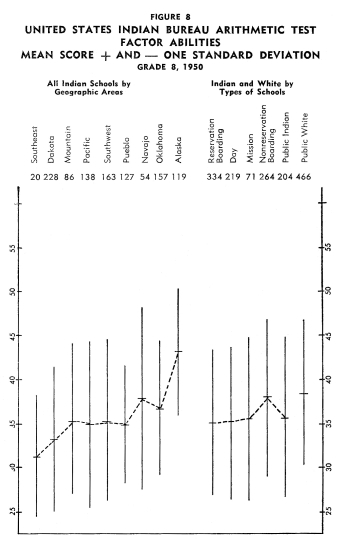
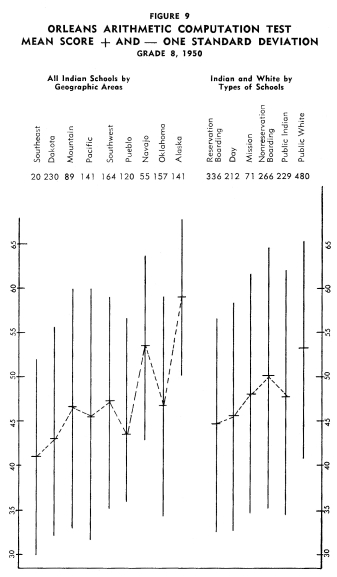
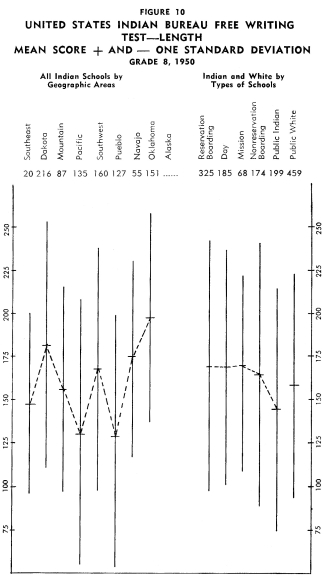
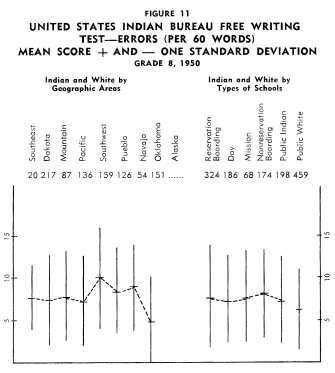
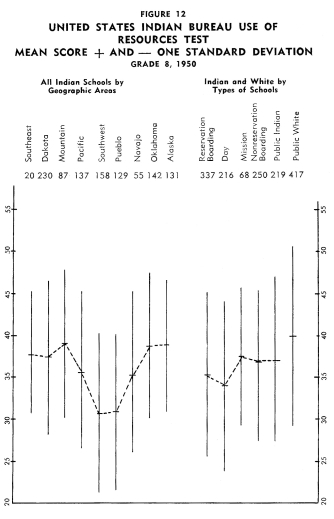
Figures 1-12 portray graphically the achievement of Indian children
in the eighth grade in the nine geographic areas. The short horizontal
line on each line graph indicates the mean score and the length
of the line indicates the range of scores for the middle two-thirds
of the students. An examination of the figures reveals considerable
variation in mean achievement in the various geographic areas,
but it also reveals a great amount of overlap in achievement. Even
though the Indian children in one geographic area have the highest
mean achievement on a particular test, there are children in the
other areas that exceed the mean of the area with the highest mean
achievement.
In order to establish ranks based upon the twelve tests as a whole,
each of the areas was given a rank on each test. The area with
the highest mean was given a rank of 1 on a particular test.
The area with the next highest mean was given a rank of 2 on
the same test. The other areas were ranked accordingly. Each
area was given a rank based on the mean rank for all twelve tests.
This system produced the following rank order from best performance
on all twelve tests to the poorest performance on all twelve tests:
(1) Alaska, (2) Oklahoma, (3)
Mountain, (4) Navajo, (5) Dakota, (6) Pacific, (7) Southeast, (8)
Pueblo, and (9) Southwest. However, on all the tests, there was
considerable overlapping, some children in all areas exceeding
the mean of the best group.
The differences in achievement noted in this discussion were no
doubt influenced by differences in cultural and educational backgrounds
of the children in the various areas. These differences in background
were discussed in Chapter II.
Although the data were sketchy, rank order correlations** were
run between the ranks on the tests as a whole and the ranks of
the
areas according to the: (1) percentages of children usually speaking
English as a pre-school language, (2) percentages of children usually
speaking an Indian dialect as a pre-school language, (3) educational
level reached by the mother, (4) percentages of children having
all Indian friends, (5) percentages of children having mostly
white but some Indian friends, (6) percentages of fullblood Indians,
and (7) percentages of halfblood Indians. The correlations were
respectively: .42, -.42, .29, -.03, -.03, -.43, and .67. In
other words, the greater the degree of contact of the Indian child
with the white man's culture, the higher he scores on educational
tests. The readers should be reminded that, for the most part,
the tests used in the 1950 testing program were originally constructed
for use with the American public school population. One must caution
the reader that the rank order correlations were based on an N
of nine and on very flimsy data. A better designed study with regard
to these factors might definitely establish the relationships suggested
here.
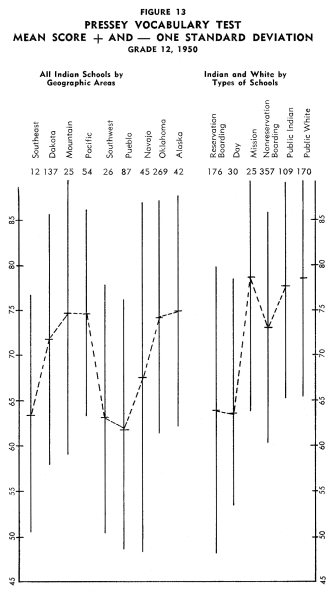
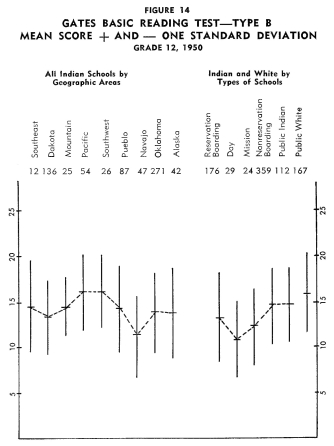
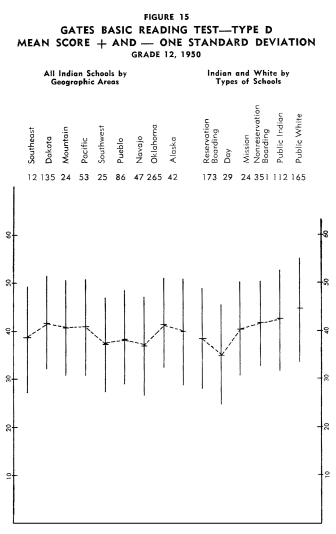
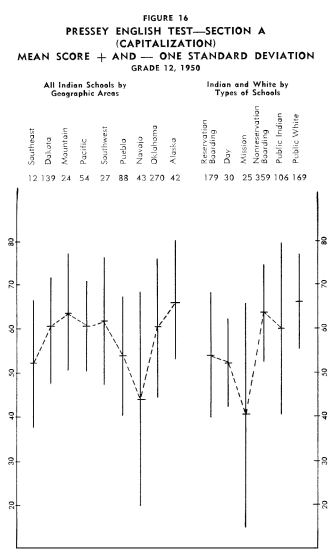
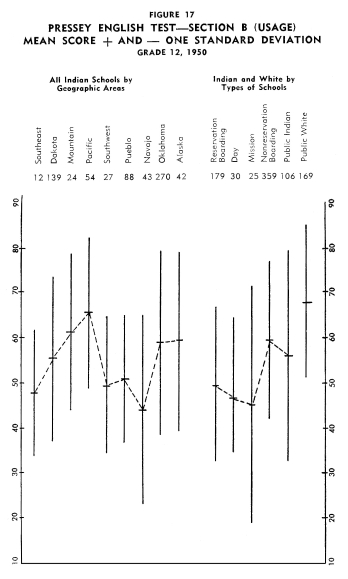
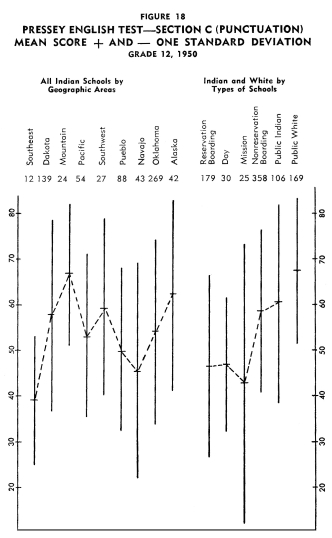
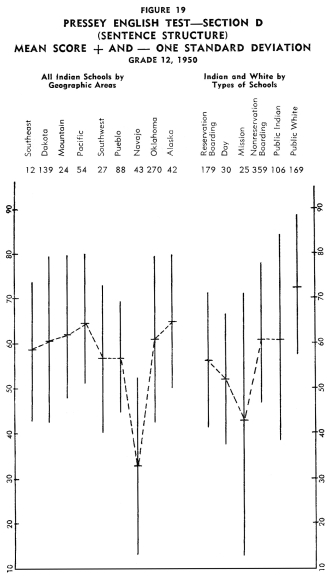
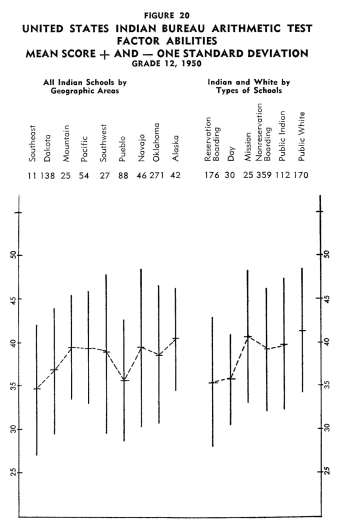
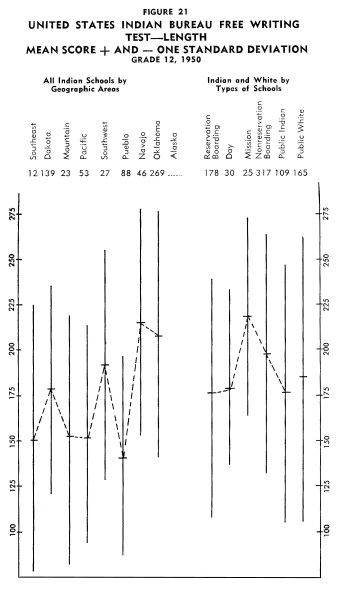
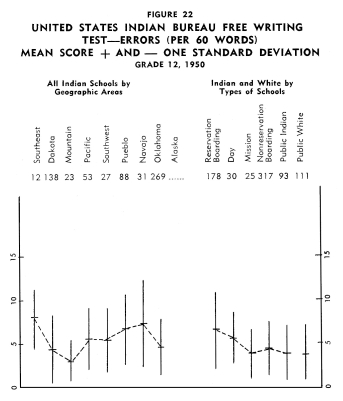
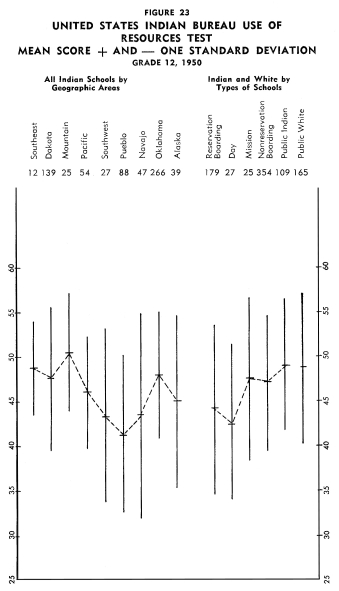
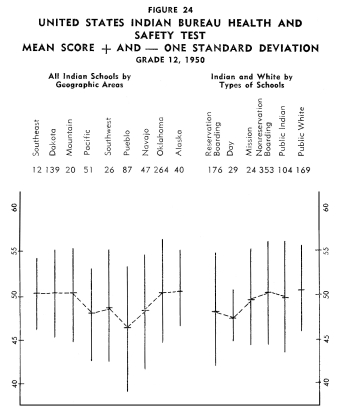
Achievement of Indian Children in the Twelfth Grade
Figures 13-24 portray graphically the achievement of Indian children
in the twelfth grade in the nine geographic areas. The same explanation
with regard to the line graphs as described for grade eight holds
for the twelfth grade.
Using the same ranking system as with grade eight, the rank order
of the areas from best performance on all twelve tests to poorest
performance on all twelve tests was as follows: (1) Alaska, (2)
Mountain, (3) Oklahoma, (4) Pacific, (5) Dakota, (6) Southwest,
(7) Southeast, (8) Navajo, and (9) Pueblo.
The differences in achievement noted were no doubt influenced by
differences in cultural and educational backgrounds of the children.
These differences were discussed in Chapter II.
Although the data were sketchy, rank order correlations were computed
between the ranks on the tests as a whole and the ranks of the
areas according to the: (1) percentages of children usually speaking
English as a pre-school language, (2) percentages of children usually
speaking an Indian dialect as a pre-school language, (3) percentages
of children having all Indian friends, (4) percentages of children
having mostly white but some Indian friends, (5) percentages of
fullblood Indians, and (6) percentages of halfblood Indians. These
correlations were respectively: .55, -.37, -.37, .40, -.38, and
.78.
Comparison of Areas by Grade Levels
The rank order correlation between the ranks of the areas on the
eighth grade level on the tests as a whole and the ranks of the
areas on the twelfth grade level on the tests as a whole was .73.
This indicates that the areas were quite consistent in performance
on the tests as a whole on the eighth and twelfth grade levels.
This tentatively establishes a hierarchy of areas with regard to
educational achievement.
THE ACHIEVEMENT OF THE EIGHTH AND TWELFTH GRADES ON THE SAME
TESTS
The children in the eighth and twelfth grades took these some tests:
Pressey Vocabulary, USIST Arithmetic-Factor Abilities,
USIST Free Writing-Length and Errors, USIST Use of Resources,
Pressey Capitalization,
Pressey Good Usage, Pressey Punctuation, and Pressey Sentence Structure.
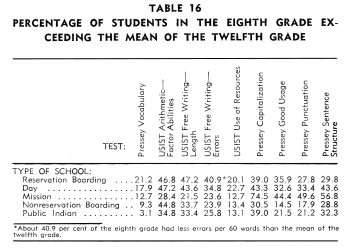
Table 16 shows the percentage of students in the various types
of schools in the eighth grade who exceeded the mean of the twelfth
grade. An important consideration in a comparison involving two
grade levels, is whether or not the tests had a ceiling for the
upper grade level. An examination of the distributions for these
nine tests showed that only one of the tests had a ceiling for
the twelfth grade. This test was the Pressey Vocabulary. About
20 per cent of the twelfth graders fell in the top class interval,
which is an indication that the same students might have scored
higher had the test been longer.
In a sense, the less the percentage of overlap between the two
grades, the greater the development from grade eight to twelve.
This would be especially true if the scores represented the achievement
of the same pupils on the same tests when in grade eight and when
in grade twelve. However, the students represented here were eighth
graders in 1950 and twelfth graders in 1950. The percentages of
overlap as shown in Table 16 are quite considerable indicating
that the students in the eighth grade had achieved higher standards
than their counterparts in the twelfth grade. This seems to indicate
that an upsurge is taking place in Indian education.
An examination of Table 16 indicates that the percentages of overlap
were lowest for the non-reservation boarding and Indians in public
schools. This would point to the conclusion that more educational
growth had taken place in four years on the part of the twelfth
graders in these types of schools than in the reservation boarding,
day, and mission schools.
ACHIEVEMENT OF THE EIGHTH AND TWELFTH GRADE STUDENTS BY TYPES OF
SCHOOLS
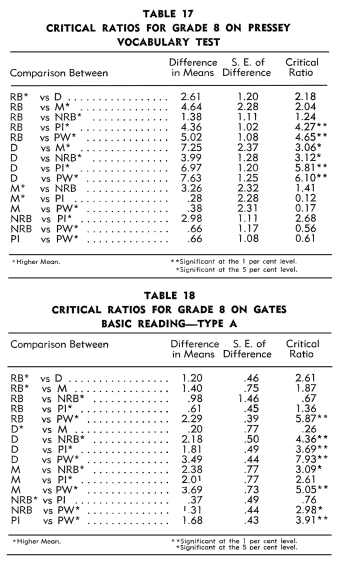
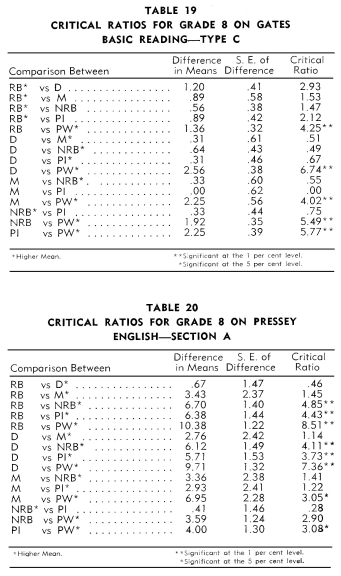
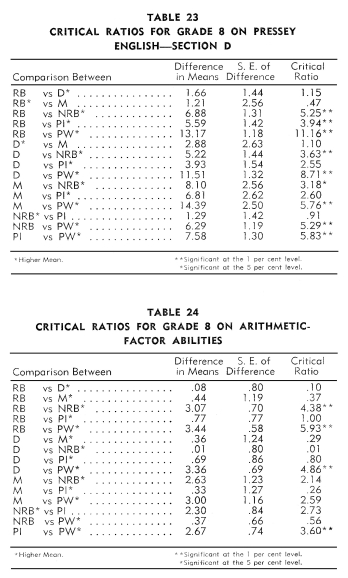
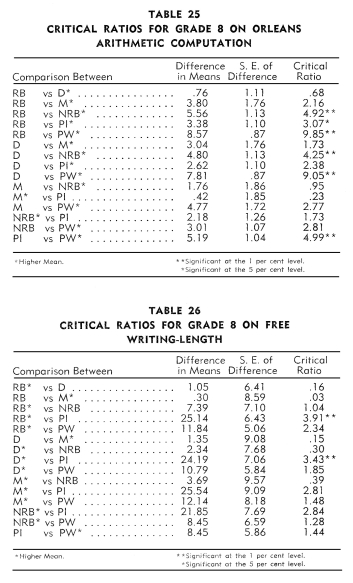
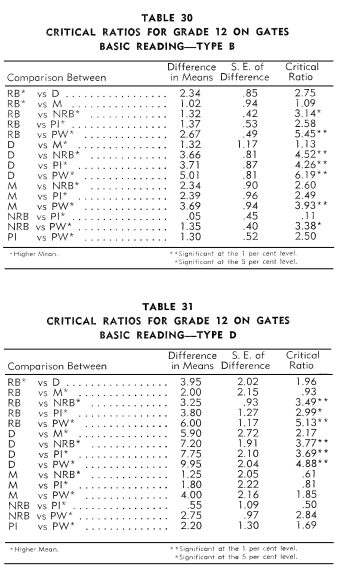
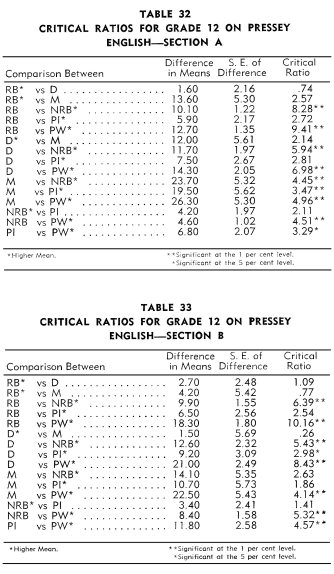
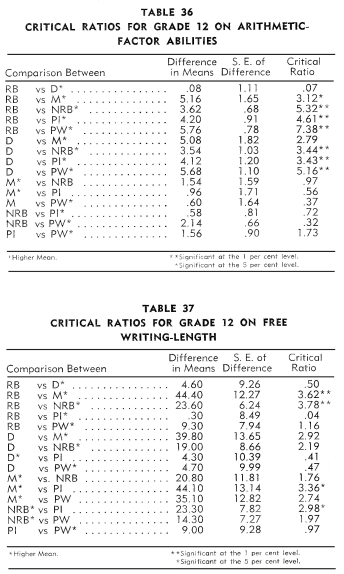
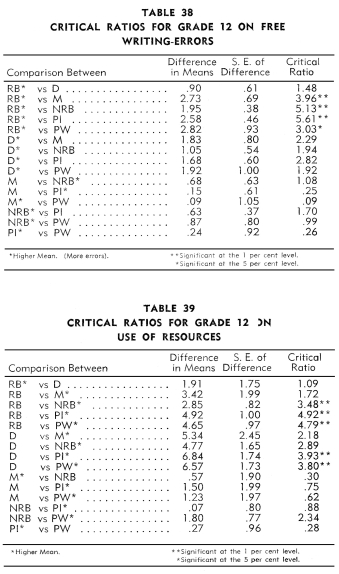
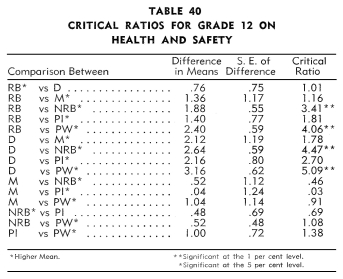
Tables 17-40 indicate the differences in means, the standard error
of the differences, and the critical ratios between the six types
of schools. Fifteen critical ratios are presented for each test.
The symbols on the left hand side of each table refer to the following
types of schools:
| RB |
-Reservation Boarding |
| D |
-Day |
| M |
-Mission |
| NRB |
-Non-reservation Boarding |
| PI |
-Indian children in public schools |
| PW |
-White children in public schools
|
Achievement of the Eighth Grade Students by Types of Schools
An examination of Tables 17-28 revealed that Indian students in
the:
1. Reservation boarding schools achieved no more on the twelve
tests than did the children in the day and mission schools.
2. Non-reservation boarding schools achieved significantly more
than the children in the reservation boarding schools on five tests:
Pressey Punctuation, Reading to Appreciate General
Significance, Reading to Understand Precise Directions, Orleans
Arithmetic Computation,
and Arithmetic-Factor Abilities.
3. Public schools achieved significantly more than the children
in the reservation boarding schools on five tests: Pressey
Vocabulary, Pressey Punctuation, Reading to Appreciate General
Significance,
Reading to Understand Precise Directions, and Arithmetic-Factor
Abilities. The reverse was true in the case of the Free
Writing Test-Length.
4. Mission schools achieved significantly more than the children
in the day schools on only one test, namely, Pressey
Vocabulary.
5. Non-reservation boarding schools achieved significantly more
than the children in the day schools on six tests: Pressey Vocabulary,
Pressey Capitalization, Pressey Punctuation, Reading
to Appreciate General Significance, Reading to Understand
Precise Directions,
Arithmetic-Factor Abilities, and Use of
Resources.
6 Public schools achieved significantly more than the children
in the day schools on four tests: Pressey Vocabulary,
Pressey Capitalization, Pressey Punctuation, and Use
of Resources.
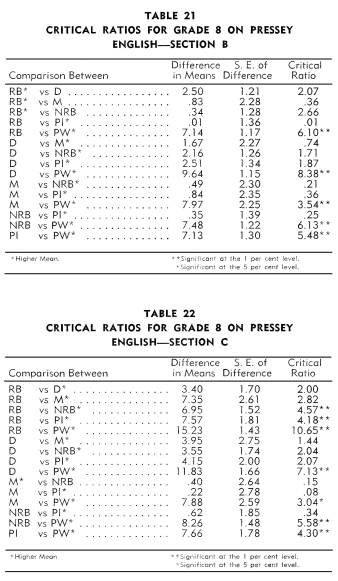
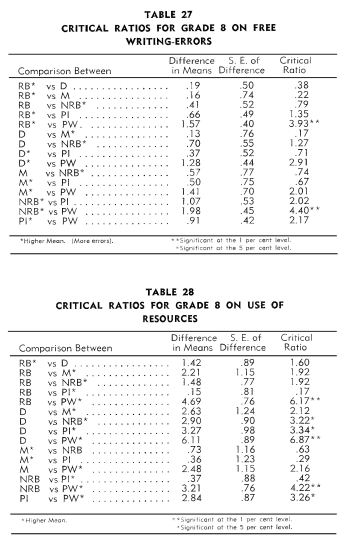
7. Non-reservation boarding schools achieved significantly more
than the children in the mission schools on two tests: Pressey
Capitalization and Reading to Understand Precise Directions.
8. Public schools achieved no more on the twelve tests than did
the children in the mission and non-reservation boarding schools.
An examination of Tables 17-28 revealed that the white children
in the public schools achieved significantly more than the Indian
children in the:
1. Reservation boarding schools on eleven tests.
2. Day schools on ten tests.
3. Mission schools on six tests.
4. Non-reservation boarding schools on seven tests.
5. Public schools on nine tests.
Thus, in competition with the white schools, the rankings of the
Indian schools in terms of significant critical ratios in order
from best to poorest were: Non-reservation boarding, mission, reservation
boarding, public Indian, and day.
Using the same ranking system as described for grade eight with
geographic areas, the rank order of the types of schools
from the best performance on all twelve tests to poorest performance
on
all twelve tests was as follows: (1) Public Indian, (2) non-reservation
boarding, (3) mission, (4) reservation boarding, and (5)
day. Although the N was only five, rank order correlations
were run between the
ranks given above and the ranks according to: (1) percentages
of children usually speaking English as a
pre-school language, (2) percentages of children usually speaking
an Indian
dialect as a
pre-school language, (3) educational level reached by the
mother, (4) percentages of children having all Indian friends,
(5) percentages of children having mostly white but
some Indian friends, (6) percentages
of fullblood Indians, and (7) percentages of halfblood Indians.
The correlations were respectively: .60, -.70, .67, -.53,
.60, -.90, and -.10.
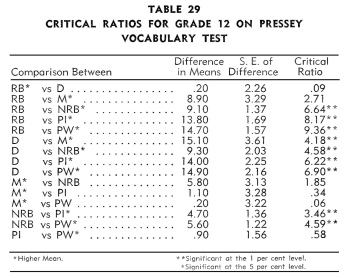
Achievement of the Twelfth Grade Students by Types of Schools
An examination of Tables 29-40 revealed that Indian children in
the:
1. Reservation boarding schools achieved no more on the twelve
tests than did the children in the day schools.
2. Mission schools achieved significantly more than the children
in the reservation boarding schools on three tests: Arithmetic-Factor
Abilities, Free Writing-Length, and Free
Writing-Errors.
3. Non-reservation boarding schools achieved significantly more
than the children in the reservation boarding schools on all twelve
tests.
4. Public schools achieved significantly more than the children
in the reservation boarding schools on six tests: Pressey
Vocabulary, Pressey Good Usage, Reading to Predict Outcomes
of Given Events,
Arithmetic-Factor Abilities, Use of Resources, and Free
Writing-Errors.
5. Mission schools achieved significantly more than the children
in the day schools on only one test: Pressey Vocabulary.
6. Non-reservation boarding schools achieved significantly more
than the children in the day schools on nine tests: Pressey
Vocabulary, Pressey Capitalization, Pressey Good Usage, Pressey
Punctuation,
Pressey Sentence Structure, Reading to Predict the Outcomes
of Given Events, Reading to Note Details, Arithmetic-Factor
Abilities,
and Health and Safety.
7. Public schools achieved significantly more than the children
in the day schools on seven tests: Pressey Vocabulary,
Pressey Capitalization, Pressey Good Usage, Pressey Sentence
Structure,
Reading to Predict the Outcomes of Given Events, Arithmetic-Factor
Abilities, and Use of Resources.
8. Non-reservation boarding schools achieved significantly more
than the children in the mission schools on two tests: Pressey
Punctuation and Reading to Note Details.
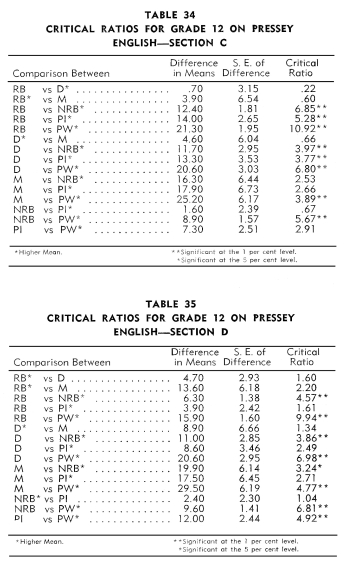
9. Public schools achieved significantly more than the children
in the mission schools on two tests: Pressey Punctuation
and Free Writing-Length.
10. Public schools achieved significantly more than the children
in the non-reservation boarding schools on one test: Pressey
Vocabulary.
The reverse was true with Free Writing-Length.
An examination of Tables 29-40 reveals that the white children
in the public schools achieved significantly more than the Indian
children in the:
1. Reservation boarding schools on eleven tests.
2. Day schools on ten tests.
3. Mission schools on five tests.
4. Non-reservation schools on six tests.
5. Public schools on three tests.
Thus, in competition with the white schools, the rankings of the
Indian schools in terms of significant critical ratios in order
from best to poorest were: public Indian, mission, non-reservation
boarding, reservation boarding, and day.
Using the same system of ranking as described previously, the
rank order of the types of schools from best performance on
all twelve
tests was as follows: (1) public Indian, (2) non-reservation
boarding, (3) mission, (4) reservation boarding, and (5) day.
Although the
N was small or five, rank order correlations were computed
between the ranks given above and the ranks according to: (1)
percentages
of children usually speaking English as
a pre-school language, (2) percentages of children usually
speaking an Indian
dialect as a pre-school language,
(3) percentages of children having all
Indian friends, (4) percentages of children having mostly
white but some Indian friends, (5) percentages of
fullblood Indians, and (6) percentages of halfblood Indians.
The correlations were respectively: .90, -1.00, -.90, 1.00,
-.50, and-.20.
Comparison of Types of Schools by Grade Levels
The rank order correlations between the ranks of the types of schools
on the eighth grade level on the tests as a whole and the ranks
of the types of schools on the twelfth grade level on the tests
as a whole, was 1.00. This indicates that the types of schools
were quite consistent in performance on the tests as a whole on
the eighth and twelfth grade levels. This tentatively establishes
a hierarchy of types of schools with regard to educational achievement.
SUMMARY
The rank order correlations for grade eight and twelve for the
various types of schools were considerably higher than those obtained
with geographic areas. Although it must be remembered that these
correlations with regard to types of schools were based on an N
of five, they do make a strong case for the statement: the greater
the degree of contact of the Indian child with the white man's
culture, the higher he scores on educational tests.
The correlations between the achievement rankings in the eighth
and twelfth grades according to geographic area and to types of
schools would seem to indicate that the same cultural and educational
factors were in operation at both levels. This tentatively establishes
a hierarchy of geographic areas and types of schools with regard
to educational achievement.
If differences in cultural and educational background will produce
differences in educational achievement among Indians, then wider
differences in cultural and educational background as they exist
between Indian children and white children should produce even
greater differences in educational achievement in favor of white
children. This proved to be true in some instances in this study.
Thus, it seems logical to say, that, as the cultural and educational
backgrounds of Indian children become more like those of white
children, the more closely will the educational achievement of
Indian children match that of white children.
* Raw or untreated scores.
** The significance of a rank correlation
coefficient may be tested by means of Olds's Tables.** When N
is 9 as in
the case of the correlations computed for the nine areas, correlations
of .60 and ?.60 would have sums of squares of rank differences
of 48 and 192 respectively. The probability of not exceeding
48 by chance alone or of getting less than 192 by chance alone,
is .0470. It may be concluded at this level, that a correlation
exists between the two rankings.
In light of the above discussion,
the probability that the sum of squares of rank differences,
when N is 9, will not be exceeded by chance alone (in the case
of a positive correlation) is: (1) about .05 when r is .60, (2) about .10 when
r is .48, and (3) about .20 when r is .33. The same probabilities hold for negative
correlations of the same size.
The probability that the sum of squares of rank differences, when N is 5, will
not be exceeded by chance alone (in the case of a positive correlation) is: (1)
about .O5 when r is .85, (2) about .10 when r is .70, and (3) about .20 when
r is .55. The same probabilities hold for negative correlations of the same size.
**E. G. Olds. "Distributions of Sums of Squares of Rank Differences
for Small Numbers of Individuals." Annals of Mathematical Statistics, 9 (March
1938) 133-149.
|