|
|
|
|||||||||
|
|
|
|
||||||||
|
|
|
|
||||||||
|
EVALUATING AMERICAN INDIAN AND ALASKA NATIVE EDUCATION by
EVALUATING AMERICAN INDIAN AND ALASKA NATIVE
EDUCATION* INTRODUCTION Evaluating American Indian education requires the best of professional educators, especially as related to the principles of fairness and accuracy. The contemporary situation in American education is dominated by high stakes testing and state level accountability programs in which American Indian education receives, mostly, unfair treatment based on culturally biased, inaccurate test data. However, it is possible within high stakes testing and state accountability programs to provide fairness and accuracy to American Indian communities. I hope in this article to suggest to evaluators how this can be accomplished. The 2000 Decennial Census (2002) reports 4.1 million people who self-reported being American Indian or part American Indian. The 4.1 million is 1.5 percent of the total U.S. population. 2.5 million of these were American Indian or Alaskan Native only, which is .9 percent of the U.S. population. An additional 1.6 million reported being part American Indian. The BIA provides services to “American Indians” who are 25 percent or more Indian by blood quantum. In this respect, “American Indian” is a legal term which applies to the BIA (and the U.S. Public Health Service Division of Indian Health) and its programs including over 200 tribes on reservations which encompass over 50 million acres of land. The BIA Office of Indian Education Programs (OIEP) was changed in 2007 to the Bureau of Indian Education (BIE) but its web site describes its Indian education base as: “OIEP has responsibility for 185 elementary and secondary schools and dormitories as well as 27 colleges. Our colleges, schools and dormitories are located on 63 reservations in 23 states across the United States serving approximately 60,000 students representing 238 different tribes.” Nationally, the American Indian population is complex, often confusing to non-Indians and offers education evaluators a great challenge to identify with reasonable accuracy who would be included in an evaluation. Nonetheless, there have been several national evaluations of American Indian education. AMERICAN INDIAN EDUCATION EVALUATION, AN HISTORICAL APPROACH1 For purposes of this paper, evaluation is defined as providing valid education information to decision makers. Evaluators don’t make administrative decisions. Evaluation differs from research primarily in the area of control of the education environment. Research usually involves a very limited number of subjects within a tightly controlled environment investigating strictly defined interventions. Even though evaluations are large in scope with limited control of the environment, they produce valid information on which decision makers can make decisions. In several instances, education research reports will be included in the literature. In developing an historical approach to American Indian education evaluation it is appropriate to start with the first quarter of the twentieth century. We start at this time as it was during the first quarter of the twentieth century that American educators began to apply scientific methodology to education. Jerome V. D’Agostino (2000) tells us that something similar to standardized tests were first introduced in Boston in 1845. During the nineteenth century scientifically developed education instruments were not applied to American Indian education. It was during the first quarter of the twentieth century that scientific instruments were applied to American Indian education. D’ Agostino also points out the importance that Ralph Tyler and “Progressive educational reformers,” played important roles in early twentieth century testing. We will learn that Tyler also influenced American Indian education evaluation. Ironically, Robert Salvin (2002) in a recent article espouses the belief that, at last, scientific methodology in education will drive transformation of educational practice and research in the twenty first century. Salvin also claims that science has yet to dominate U.S. education processes. The application of scientific methodology, borrowed from the natural or hard sciences such as physics and chemistry and the employment of advanced mathematics, is not a bad development. Scientifically developed education instruments, like all science, requires specificity and intellectual rigor. It focuses thought and education activities in a very specific manner. Scientific education instruments are usually based on a specific target population such as the total U.S., college level students, etc. If applied to that population they can be helpful to professional educators working in schools specific to the targeted population. On the other hand, achievement tests have historically been developed for the U.S. as a whole, and have reflected only the Eurocentric2 based culture and related population. Without developing special norms for sub-cultures, such as Navajo, Eskimo, Sioux, etc. achievement tests produce inaccurate scores. BACKGROUND ON EDUCATION RESEARCH AND INDIAN/NATIVES Robert Havighurst (1957), the noted education researcher at the University of Chicago, contributed enormously to the education research on American Indians. His article in the 1957 issue of The Annals is a good place to start. In this article Havighurst refers to a 1928 research project on intelligence. The following paragraph makes the point of cultural fairness and standardized instruments.
Klineberg published his article in Archives of Psychology, 1928. Havighurst also includes intelligence test results as related to American Indians. Such tests developed for Eurocentric, English speaking populations, have not produced reliable American Indian IQ’s. However, the several non-verbal tests, including the “Goodenough Draw-A-Man Test,” used since 1926, compare Indian children with non-Indian children in a more equal and fair manner. In the early 1940’s Havighurst did intelligence research on Navajo children. He had this to say about his work.
Over 60 years later, things haven’t changed at all regarding the use of intelligence tests that Havighurst reported. Havighurst benefited from the BIA’s national Education Program office Chicago location. In 1941 the “Indian Education Research Project,” was initiated at the University of Chicago by the BIA (Zintz, 1969, pp. 131-132.). Perhaps one of the earliest and most in-depth study of one American Indian education group was conducted by two Stanford University researchers, Dewey Anderson and Walter Eells (1935). They spent two years trekking throughout Territorial Alaska applying standardized tests of achievement and intelligence to Eskimos, Indians and Aleuts. Frustrated with the dramatic difference between Alaskan Native language, cultural and social conditions and the Stanford Achievement test or the Stanford-Benet Intelligence Test, the researchers attempted on-the-spot modifications in order to develop different data. It was interesting in that a main source of information on Alaskan Natives was mostly provided to the researchers by local non-Natives, many of whom operated isolated trading posts. It is important that standardized evaluation instruments provided only minimally useful results. The most important finding of this massive work was that Alaskan Natives were (and are) very different culturally from the norming groups of the instruments, consequently, standardized instruments and related statistics based on norming groups, should be used on Indians/Natives with great caution. Up until about 1946, the BIA headquarters office for its national education program was located in Chicago. It is not surprising that the University of Chicago played an important role in evaluating American Indian education. With the advent of the famed Meriam (1928) report and the change in administration to Franklin Roosevelt, important changes in American Indian education were implemented. Roosevelt appointed John Collier as Indian Commissioner (Philp, 1981), who appointed Progressive Educator Edward Everett Dale as his Education Director. Dale began a long influence on BIA Education by the Progressive Education movement (Goodenow 1980). When Dale left the BIA another Progressive Educator, Willard Beatty (Squire 1972, p. 214), was appointed as Education Director. Collier, who espoused “Social Engineering,” (Boyce, 1974) and his Progressive Education Directors of Education were partial to evaluation data to prove effectiveness of Federal schools compared to public schools. FOUR NATIONAL EVALUATIONS, 1944 - 1970 In the contemporary standards based education reform for most states, standardized tests are used in ways the test developers say they should not be used. Standardized tests cannot measure a total education program which includes affective and cognitive domains. Further, to produce accurate evaluation data on a reform program the curriculum content, teacher education and assessment (tests) must be aligned (Schoenfeld, 2002). This is a simple, age- old education principle which says that the content taught children determines the content of the tests and that teachers are educated to teach said curriculum content. There is an extensive literature on evaluating Indian/Native education most of which has been produced by serious and competent professionals. There are three components of each evaluation that lead us to a conclusion about fairness and accuracy in Indian/Native education evaluation. First, each publication reflects a purpose which we find is basic to the quality of the evaluation. Second, though there has been less attention to who was included in the evaluation, there was at least some statements defining the Indian/Native population being evaluated. Third, methodology while not receiving the discussion it deserved, was reasonably reflected in the instruments and analyses. There were four national evaluations of Indian/Native education. All four were paid for by the BIA and had a major purpose of comparing the relative effectiveness of the BIA education program schools compared to public and mission schools and Indian and White students. The first was contracted to the University of Chicago, the next two to the University of Kansas and the fourth conducted without university assistance, was contracted to the Southwest Regional Laboratory, a Great Society creation. There was continuity between the four evaluation that was provided by L. Madison Coombs, an employee of the BIA’s Education office. Coombs was a major role player in BIA education evaluation and research from about 1948 to 1970. The general design of the four evaluations was set by the first evaluation. Because the first evaluation more or less established the basic design for all four, it will be discussed in more detail and its design used to describe the following three. Since I have included Alaska Natives along side American Indians it is important to identify when Natives were involved in the four evaluations. Accordingly:
The Peterson Evaluation, Number One The first national evaluation of the education of American Indians (American Indians) was contracted by the BIA to the Education Department of the University of Chicago. This evaluation started with a “Pilot study” in 1944 and gathered data in 1945 and 1946. Shalier Peterson (1948) in the Preface mentions that “Mr. Willard W. Beatty, Director of Education for the Office of Indian Affairs, consulted with Mr. Ralph W. Tyler, Chairman of the Department of Education of the University of Chicago and asked the University to provide assistance in planning this project, in guiding its execution and in analyzing the data gathered.” Tyler also contributed a section (pp. 113-117) to the book. Among others, Hilda Taba was a Research Associate and an Assistant Professor at the University. It should come as no surprise that the BIA Education Program had well defined objectives. Peterson quotes from the Civil Service examination:
Peterson states the purposes of the evaluation as:
As pointed out above, the BIA was the major education institution providing schooling to Indians on reservations. The purpose of the evaluation was generally, in line with the famed eight year study of progressive vs traditional education. The “New Deal” BIA had instituted a new bicultural program, which was referenced above in the purpose (Szasz, 1977). The evaluation question was, “Did Indian students exposed primarily to the new program do better than those who were not exposed to the traditional (old) program?” As Tyler in his section reports:
Purpose. The purpose of this evaluation was to evaluate the BIA Education program and make comparisons between BIA and other schools in order to determine if the BIA progressive education program was as good as other programs. This was a large scale evaluation intended for use by administrators and policy level officials. Indian/Native Students. The Indian students included in the evaluation attended BIA, public and mission schools. Students in grades 4, 8 and 12 were evaluated. Indian students met the BIA legal requirement of with a blood quantum of 25 percent or more “Indian”. The report is very detailed in the instruments used for each grade level. There were 5,324 students attending six different types of schools. This was a “National” evaluation in that it evaluated the BIA Education program nationally. It did not include all American Indian students attending schools throughout the U.S. While the evaluation was longitudinal, 1944 - 1946. Students were not tracked individually. The report states, “In interpreting the tables and charts, it is necessary to keep in mind that these data describe three separate groups of students instead of the same students at three periods.” (p. 29) Curriculum. At that time, 1946, the U.S. Indian Service (USIS) had specific curriculum guides. Its Education purpose, as described above, was clearly stated. Evaluators tried to align tests with some aspects of the curriculum. Instrumentation. Fourteen different evaluation instruments were used. Three of these were standardized tests two pertained to background information and five special instruments which were based on the USIS curriculum. Scientific methodology was used throughout. Chapter Two contains details on instrumentation. The USIS instruments as well as the “Free Writing” test samples are printed at the back of the report. Background Data. Test data was linked to the “Background Questionnaire.” Background data was very important to interpretation of test results. Chapter Three, “Differences in Student Backgrounds,” provides a detailed discussion of the links to test data, including cultural backgrounds of students. It is interesting that the evaluators of 1944 thought test scores should be related to background characteristics. Indian/Native Blood quantum. As mentioned above, blood quantum is a legal term related to attendance at BIA funded schools. It was assumed in the Peterson evaluation that the greater the degree of Indian blood, the closer the individual was to the Indian culture. The report states, “The data do not justify a conclusion that school success is limited by degree of Indian blood.” (p. 29) Figure 1 Peterson Data Statistics. Raw scores from standardized tests were used to illustrate relationships between scores and background characteristics. Median scores were illustrated graphically as was the range of raw scores. In fact, medians were used most often in reporting raw test scores. Number of students on which the graphs were based were also included. Percentages were used in reporting background characteristics. Range of data were also presented with a three part division between the bottom third, the middle third and the top third for each instrument. Figure 1, above, is from the Peterson report. Test Norms. Test norms, or “National Norm Equivalents” were reported. This is nowadays referred to as “Grade Equivalents.” It is interesting to note the comment about the use of test norms with Indian students.
Interestingly enough, the general rule expressed above about the 1944 - 46 evaluation is just as valid today as then. The graphic presentations juxtaposed, side by side, raw score data and test norm data. The comparisons are interesting. The Anderson Evaluation, Number Two The second national evaluation was conducted by Anderson, Collister and Ladd (1953) at the University of Kansas. By the time this evaluation started Madison Coombs, a former Kansas county school superintendent, had joined the BIA Education program and was stationed at Lawrence, Kansas on the campus of the then Haskell Institute, now the Haskell Indian University. Coombs was instrumental in selecting Anderson to lead the evaluation and was also instrumental in setting the design for the evaluation. Coombs is acknowledged in the report frontispiece. It borrowed a great deal from the University of Chicago evaluation.
Statistics. Since computers were used with data analysis different statistical analysis were also used. The Standard Deviation of the Mean was the main statistic used by Anderson. Statistical significance was also used as were “F” values and “t” ratios and the “Behrens-Fisher “d” test. In fact, Chapter III is titled, “Statistical Treatment of the Test Data.” Further, Chapter IV is titled, “Results of the Statistical Treatment of The Test Data.” “Raw or Untreated Scores” were used for statistical procedures. The first paragraph in Chapter IV explains the treatment of data.
Figure 2 Anderson Data Figure 2 illustrates Anderson’s graphic illustrations of test data. Anderson’s more sophisticated statistics limited dramatically communication of findings to program and policy officials. By the time the Anderson report was published, 1953, Willard Beatty had left the BIA and been replaced by Hildegrad Thompson. Thomspon did not have the sterling Progressive Education credentials as Beatty, but she appeared to follow the philosophy of progressive education. The Coombs Evaluation, Number Three The Coombs evaluation reflects a clear departure from the previous two evaluations. The previous two evaluations cite the 1928 Merian report as a benchmark for assessing the education of Indian/Natives. Coombs also cites the Merian report. However, the subtitle to Coombs evaluation is, “A Study of Interracial Differences.” Basically, Coombs changed the focus of the evaluation away from assessing the effectiveness of the BIA education program as compared to others to assessing, “Learning,” and achievement of Indians and whites as measured by achievement tests. In this study the California Achievement Test was used, which is another departure from the previous two studies which tried to maintain the integrity of test instruments between evaluations. In this respect, the Coombs evaluation becomes almost a new approach to evaluating Indian/Native education. Basic policy regarding the education of Indian/Natives is set by the Congress. Lyman Tyler (1973), a history professor at the University of Utah, wrote a book on Indian policy and the Government published it. During the 1950’s, the period in which the Coombs evaluation took place, the policy of the Federal Government, as determined by the Congress, was to “Terminate” Federal services to Indians. Regarding education, Termination meant turning over BIA schools to the public schools. It should be remembered that the previous two studies took place under the influence of the “New Deal” and the progressive education movement. With Coombs the foundation of policy shifts to something titled, “Inter racial.” Another very important feature of the Coombs evaluation was that the overall design and work was done “In House.” This meant that Coombs, as a Civil Servant, an employee of the BIA, administered and controlled the evaluation, including the writing of the report. The professors at the University of Kansas, who shared authorship, provided technical assistance in the form of data entry and statistical analysis. Otherwise, this was an “In House” evaluation. The two previous evaluations were administered by higher education institutions and professors with the BIA providing support. The Coombs evaluation reversed the roles of the Government and higher education, and it is reflected throughout the report. Major Characteristics of the Coombs Evaluation Data Gathering. The two previous evaluations were very clear and explicit about who was included in the evaluations and when the data was gathered. Coombs does not reflect such a clear statement about data gathering. But, when one digs deeper it comes as no surprise that data gathering was controlled by the BIA field administrators. While Coombs reports a total of 23,608 and the breakdown by racial groups and schools, he was not clear on the time data was gathered. Background characteristics were included in the data structure. Time and Data Organization. Without line authority to Education employees, Coombs had to allow the field administrators, Agency School Administrators, to control who was to be included in the evaluation as well as when data was to be gathered. The BIA, starting with the Termination period, was divided into “Area Offices,” and it was these offices that determined that no total BIA administration of tests would take place during the 1951 - 1954. Without knowing the organizational structure of the BIA, one could think this was a longitudinal study, which it was not. Table 3-a (p. 18) provides the administrative areas and the number of “pupils” tested in each. There were six administrative areas at the time of the evaluation and all were tested in the fall of a year. While the evaluation program was initiated in the fall of 1951 and continued through 1954, each administrative area was tested only once in the fall of a year. Grades Tested. Grades four through twelve were included in the evaluation whereas previous evaluation tested grades four, eight and twelve. The rationale for this was one of the purposes of the evaluation which was to improve learning and instruction at the local levels. Grades one through three were excluded because there did not seem to be a good achievement test available for the primary grades. Evaluation Results. Coombs, like the other evaluations, is balanced in the discussions regarding test results, race and Indian cultures. He reports that, according to test scores, whites make higher scores than Indians. He, like the others, includes important discussions of age-grade results. Indians, because of language spoken in the home, were more often than whites, older for their grade placement. Pupils were old for their age and made lower test scores. Coombs established an “Order of achievement of Race-School Groups,” which was:
Chapter VI is an excellent discussion of cultural and environmental factors on achievement. Blood quantum is again discussed but found not to be a basic factor regarding achievement. Coombs also made note of test scores and progress through the grades wherein Indians fall further behind whites as the progress through school. Predictive Use of Tests. Coombs devoted considerable space to using tests to predict educational outcomes of Indians. Since there were no longitudinal data on which to base conclusions, his discussion was speculative. Haskell vocational program which enrolled high school graduates wanted to use test scores to predict probable success. Statistical Procedures. Because of the importance of administrative areas in the evaluation, statistical procedures accommodated the politics of them. Coombs developed a “Composite Norm.” for the different administrative areas. It was based on means.
Figure 3 Coombs Data The graphic presentation of data is shown in Figure 3. T scores are also figured on raw scores. Almost as an after thought, Appendix D presents additional statistical analyses on T scores level of significance. Obviously, statistical procedures other than means would not go over well with the area administrators. The University of Kansas assisted Coombs with database management and statistical procedures. Bass Evaluation, Number Four Willard Bass (1971) working at the Southwestern Cooperative Educational Laboratory, a creation of Lyndon Johnson’s Great Society, conducted the fourth and final evaluation in the series that started at the University of Chicago in 1944. It is remarkable in American education that we find some continuity that was initiated with the Meriam report in 1928 and was concluded with the Bass evaluation in 1971. It is suggested that this little known continuity which drew heavily from progressive education’s concern for effectiveness of school types, is a remarkable U.S. education phenomenon. As much as any one individual, Madison Coombs was responsible for this rare continuity. He received no credit whatsoever for making the continuity possible. Coombs picked up on the Chicago evaluation when he joined the BIA staff at Haskell after World War II and worked with Anderson on his evaluation. Anderson makes clear, unambiguous reference to the Chicago evaluation. Then, Coombs and his evaluation, an internal evaluation conducted by BIA from 1951 - 1954, continued evaluating school types. Bass makes clear the role of the Coombs evaluation as a benchmark for his evaluation. Regarding the Anderson evaluation and the Bass evaluation, within the BIA, Coombs was the “Contract Officer’s Representative,” which means that he was the main Education officer overseeing the evaluations from within the BIA. The Bass evaluation therefore reflects the last study of an evaluative concern for the effectiveness of schools types that was initiated in 1928 and continued through to 1970, a period of 42 years. Structure and Content of the Bass Evaluation Research Design and Approach. In contemporary understanding of education research, the Bass evaluation was designed and conducted with disciplined strictness. It employed sophisticated statistics on a sample of students who attended a sample of schools. It used several scientific instruments including the California Achievement Test and the California Test of Mental Maturity as well as several others. Individual Differences. “Background Characteristics” were included in all the evaluations and Bass refers to them as “Individual Differences.” Achievement between schools was controlled and achievement according to individual differences was also controlled. While there were no statistically significant differences between types of schools, there were also no differences in school effectiveness when the same types of students were compared. Low achieving students who had common background characteristics in public schools made no higher achievement than a low achieving student in a BIA on-reservation school. Using a Sample of Schools. Bass used only a selected, not a random, sample of the different types of schools. This placed the entire evaluation within the world of probability. The previous evaluations evaluated hundreds of Indian children and youth whereas Bass selected only a sample that would reflect the administrative areas of the BIA, which was in keeping with the Coombs structure. Using a Sample of Students. A stratified sample of 3,375 students in grades nine through twelve were included in the evaluation. The students were tracked from year to year. In the spring of 1970, 837 students were tested. It is a safe assumption that the Indian/Native students met the BIA blood quantum requirement inasmuch as Madison Coombs selected the schools for Bass so they would reflect BIA administrative areas. Longitudinal Evaluation. The Bass evaluation started in the fall of 1966 and continued through to the spring of 1970. A “Pre” and “Post” test was administered each fall and spring for four school years, 1966-69 through to 1979-70. Secondary Education. Bass evaluated only high schools, grades nine through twelve. Perhaps as much as any part of the evaluation, no discussion was made of the history of secondary education of Indians/Natives. Historically, the BIA high school curriculum and instructional day were divided equally between vocational and academic instruction. Enrollment in a vocation was required of each student. Academic instruction was linked to the vocational curriculum that dominated high school education from the nineteenth century through about 1957. In 1957 the BIA started changing its high school curriculum by dropping the vocational requirement and implementing a stronger academic curriculum. No mention was made of the lack of secondary school facilities available especially to Navajos and Alaska Natives. For example, as late as 1964 the only high school available to Alaska Natives was Mt. Edgecumbe, a boarding school located at Sitka. Further, only a scattering of high schools were available to Navajos. The Fort Wingate High School for Navajos, a boarding school, was not completed until 1967, which was in the middle of the Bass study. Otherwise, Navajos attended public high schools located on or near the Navajo Nation. Regarding Navajos, the lack of elementary schools on the reservation severely impacted negatively secondary education numbers. The effect of this condition was that there were literally thousands of American Indians denied a high school education simply because there were no elementary or high schools for them to attend. Obviously, had attention been given to the high school age students not in any school, a modified finding on achievement would have been reported. There is a pattern in the history of evaluating American Indians to include only those children and youth in school. If for some reason a student is not attending a school they are excluded from the evaluation. A focus of the evaluation on school types and achievement says nothing about the children and youth who leave school in large numbers during the six though nine grades. Instruments. In addition to a questionnaire, which was included in all four evaluations, Bass used the following instruments:
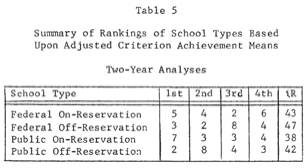
Statistics. Means were developed from raw scores and analysis of covariance were run. Tests of significant differences were run. Bass succinctly states the conclusion of his evaluation: In the light of the above findings it can confidently be concluded that when initial individual differences in scholastic aptitude and academic ability were controlled there was no evidence that academic achievement of American Indian students was greater in one type of school than in another. (p. 81) Bass did not include graphic illustrations of data but did provide numerous tables. A summary type table above is an example of the Bass data displays. Figure 4 Bass Data Table 5 Observations from the Four Evaluations It can be said that the four evaluations, all of which were funded by the Federal Government’s Bureau of Indian Affairs, reflect seven decades of common school education of American Indians, 1900 - 1970. Some general observations from the evaluations can be made.
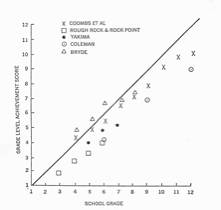
1970 - 1979 EVALUATIONS National Studies of Indian Education (NSIE). There were no regular, large scale evaluations following Bass study. Perhaps the four studies and the 30 years of Indian education covered therein established predictable standardized test results. Late in the 1960’s, which was during the time public schools assumed major responsibility for educating American Indians, there emerged new concern for the well being of American Indians, including their education. Alaska Native education primarily in isolated villages, remained the responsibility of the BIA. But, this was changing. This concern was motivated by Senator Robert Kennedy’s study of the education of Indians (U.S. Senate, 1969). The Kennedy study generally described the education of Indians as being in a sad condition. It is important that the major contribution of the Kennedy study was creation of and establishment of the Office of Indian Education (OIE) in the U.S. Department of Education. The OIE approaches Indian education on a scale similar to that of the Decennial Census definition of Indian. Within the Government, it was decided that a very large research project should be conducted. This study became the NSIE and was funded by the then U.S. Office of Education to the University of Chicago (Fuchs and Havighurst, 1972). The research was carried out by eight universities from 1967 through 1971. It is not surprising that Robert Havighurst was the “Principal Investigator.” He was assisted by a co-Principal Investigator, Estelle Fuchs, a cultural anthropologist from Bank Street College. The committee which developed the content of the research made a special recommendation that no new testing be undertaken and none was undertaken. An important departure of the research pertained to American Indians included in the study. They did use the BIA blood quantum definition and also included self-reported Indians. Fuchs and Havighurst did discuss achievement as reported in extant evaluations (Ibid. Chap. V). The Coombs evaluation was discussed as the most extensive ever undertaken. The Bass evaluation report was not available for the NSIE, but the Coleman (1966) study was. The NSIE compared several testing reports and concluded that the data, “. . . place Indian pupils just below the national average during the first four school years, and then they drop substantially,” (p. 123) There was an exception to this pattern which was reported by John Bryde (1970). Bryde reported that Sioux children made at or above grade level on standardized tests up and until grade six. After grade six they fell below gradually until they were at least two years behind in grade twelve. Bryde, and others, (Coombs) called this phenomenon the, “Cross-over Effect.” Because the cross-over effect was very different from previous evaluation data, Fuchs and Havighurst went to the Bryde original data for analysis. Bryde had test scores on Sioux children in grades 7, 6, 5 and 4. He had 147 eighth grade children but only 65 of them were in the database in grade four. Fuchs and Havighurst thought the data reduced confidence in the quality of the findings and the cross-over effect phenomenon. They thought Bryde would have been better off to base his study on the 65 children who were in his database from grade four through grade eight. The cross-over effect was, therefore, seriously questioned. Coombs also reported the cross-over effect happening at grade four. It should be noted that the cross-over effect is based on test norms “Grade Equivalent” scores, not raw scores. I well remember being a party to Coombs and Brydes discussions of the cross-over effect. Figure 5 Fuchs and Havighurst Test Data Fuchs and Havighurst illustrated the major testing studies as presented in Figure 5. Of the five evaluations included in Figure 5, only the Rock Point and Rough Rock data is definitely based on an English as a second language Navajo school population. Fuchs, a cultural anthropologist from Bank Street College, obviously, included a discussion of “Indian culture,” that she suggests has over time evolved and has the following characteristics: “. . . close family solidarity and cooperation with mutual support among the kin-folk, cooperation rather than competition among members of a given age group, belief in the values of a tribal tradition, belief in tribal religion, and a tribal language.” (p. 129) Educators undertaking U.S. national evaluations of American Indian education could profitably employ this definition for an “Indian” culture. All other research recognizes that culture is tribal based and different one from the other. The Cross-Over Effect. The cross-over effect happens around the fourth grade. It is based on American Indian grade equivalent scores in grades one through four are higher and in some studies, even above grade norms, and then begin a gradual decline until at grade twelve they are two levels below norms. Regarding achievement tests, Indian children do produce higher test scores below grade four, but not always at test score grade level. Hopkins (2002, Op.cit.) has performed correlation’s on two Navajo schools which includes test scores and teacher grades. He found no correlation’s between test scores and teacher grades below grade four but strong correlation’s starting at grade five and continuing through high school. He suggests that primary teachers (he has been a primary level classroom teacher) are more interested in child development than academic achievement. Perhaps, also, the lack of focus on academic achievement at the primary level is a good approach to academic achievement. BIA, 1970 - 1979 BIA Evaluations. From 1964 through 1979 the author was intimately involved with the BIA education evaluation function at the Washington level of the Education Program. First I was an “Education Specialist, Secondary,” and served as a team member at boarding school evaluations. Starting in 1968 I was Chief of the Division of Evaluation and Development and starting in 1971 Chief of the Division of Evaluation, Research and Development. Starting in 1958 as an administrator and continuing through to the time until he retired, and afterwards, I worked for and with Madison Coombs. I was thoroughly familiar with the use of standardized test to evaluate the BIA’s Education Program and saw no need to use them during the 1970’s. My approach to evaluation was to use a program review format, which could or could not include standardized test scores. Evaluations conducted were published as they were completed. Most of all, evaluations were to be professionally conducted with fairness and openness to all. Cultural fairness seemed most important evaluation characteristics of all. BIA Publications. The BIA created two important publications that made available evaluations of all types. One was the “Research and Evaluation Report Series,” and the other was the “BIA Education Research Bulletin.” Both of these publications made available on a regular basis a large number of evaluation and research activities. It is important to note that Deyhle and Swisher (1979) did not include any of these publications in their review of educational research on American Indians. Dr. William J. Benham (Creek)*** was head of the BIA Indian Education Resource Center (IERC) that created the publications and Dr. Eugene Leitka (Choctaw) was editor of the BIA Research Bulletin (Hopkins, 2007). Several of the contributors were American Indians. The Research Bulletin was published
quarterly from 1972 through 1979. A sample of the articles reflects concern
for the evaluation of effectiveness of most BIA Education programs. For example,
Bruce Pray (1975) addressed the use of standardized tests with Indian high
school students; Annabelle Scoon-Rosenbluth (1975) researched the feasibility
of test translation from English to Navajo and Ethel Capps reported on her
masters thesis on reading levels for Navajo high school graduates (1977). Capps,
an experienced reading teacher, expressed the belief that timed tests were
a determent to test scores and if Navajos had more time they would make higher
scores. More importantly, Navajos didn’t
need high school grade level test scores in order to do well in school. The
Bass evaluation was reported, too. James C. Martin, an American Indian with
a Ph.D., contributed important articles on the Indian self identity and was
co-principal investigator of the Oklahoma Indian Education Needs Assessment,
which is the only quality statewide needs assessment ever conducted (1977;
1979 and USBIA No. 43). In summary, the total of 89 articles printed in the
BIA Education Research Bulletin provide an excellent summary of what the
agency thought important regarding evaluation and research of American Indian
education during The Research and Evaluation Report Series, also reflected what the BIA thought important in evaluating American Indian education. For example, Report No. 03 is titled, “Rough Rock School Evaluation.” (USBIA, 1979, No. 01)3 Rough Rock was the first Indian controlled school and the IERC was requested by the school principal to conduct the evaluation. Then, there was the “Oklahoma Indian Education Needs Assessment, “Results of the Test of Proficiency in English as a Second Language in Grades 4, 5, and 6 of BIA Schools, School year 1971-72, “(USBIA, 1979, No. 13) and “Evaluation Report of the Indian Education Administrator Training Program At the Universities of Harvard, Penn State and Minnesota, Descriptive Analysis, 1975.” Almost every BIA Education program initiative is covered in the Series. There were nine individual schools evaluated. It is unfortunate, boarding on tragic, that the copies of these reports were trashed by the Deputy Assistant Secretary. These two publications also reflect an increasing BIA education evaluation and research sophistication. Based on contemporary discussions in the American Education Research Association’s (AERA) Educational Researcher (Anderson 2002; Haywood Metz and Page, 2002) discussions of “Practitioner Research,” most of the BIA publications would fall within this definition. This is not to say that BIA professional educators anticipated the 2002 AERA discussions for such was clearly not in the works in the 1970’s. What it means is that most all the doctoral level BIA employees earned their degrees while working closely and in some capacity, within and outside of BIA, in American Indian education. The BIA Education Research Bulletin provided immediate and welcoming publication of the research.4 While there were no national BIA or other evaluations of American Indian education in the 1970’s in the style of the four previously discussed, there were national evaluations of the BIA Higher Education (USBIA, 1979, No. 20) program and an extensive survey of 17 off-reservation boarding schools (Sahmaunt, 1979). This evaluation was initiated by the Deputy Assistant Secretary for Indian Affairs who wanted to close the schools. School Administrators thought differently and believed that describing the characteristics of the students would justify not only keeping the schools open but increasing their budgets to serve the extraordinary needs of the students. A data form was developed, professional educators were sent to the schools, and data was taken from the students “Permanent Folders.” The evaluation had over 7,000 students in it. The data was massive in scope and included standardized test data and an estimated “Academic Achievement” based on teacher grades. The test data was not of good quality but achievement based on teacher grades was and reflected something close to a normal distribution. Figure 6 below illustrates the historical standardized test scores and teacher grades. It is interesting that both standardized test scores based on test norms and teacher grades will reflect this pattern Nationally, regardless of the tribal culture of the students. Given the bias of normed tests, it is suggested that teacher grades might be used in juxtaposition to test norms. Figure 6 Achievement tests vs Teacher Grades Policy, Indian Self-Determination Act. The Indian Self-Determination policy was initiated by President Johnson and formalized by President Nixon. Basically, the policy and statute provide authority for an Indian tribal government receiving services from the BIA to assume control of a program and administer it to tribal members. The policy clearly provides legal authority for tribes to assume control of and administer a BIA program. Pertaining to education, it is reflected in tribal control of BIA funded schools, the first of which was Rough Rock Demonstration School located on the Navajo Nation (Johnson, 1968; Op.cit. USBIA, 1979, No. 01). Currently, the BIA reports that 120, 65 percent, of its total of 185 funded schools, are under Indian control (USBIA, 2002). Bilingual Education Bilingual education which conducted instruction in two languages, Indian and English, was initiated in BIA funded schools. The first was Rough Rock, a Navajo school. At about the same time, 1970, two language schooling was also initiated by the BIA in Alaska with the Yup'ik dialect of Eskimo. (Op. Cit. Hopkins, 2002). Evaluating American Indian bilingual education presented interesting evaluation challenges. At the time of implementing them, there was an anti-bilingual position which expressed the belief that teaching in English, only, was the most effective, and a patriotic approach to educating any one, including American Indians. Unfortunately, this approach is still with us in the 21st Century and has many adherents among Indian populations. In almost all programs, evaluations of American Indian bilingual education used standardized achievement tests in some manner. Most often, standardized tests were used to prove that bilingual education was as effective as English, only (Rosier and Holm, 1980; Rosier and Ferella, 1976). The Navajo Rock Point School also used the Test of Proficiency in English as a Second Language (TOPESL) which was developed by Eugene Briere at the University of Southern California under contract from the BIA ( Briere, 1969, 1970; Op.cit. USBIA 1979, No. 13). The Window Rock (Navajo) public school district in Arizona, developed and made available, “The Window Rock Oral Language Test (WROL, 1981) which was for the primary grades, but it has been used at upper levels, too. The WROL has been used extensively with Navajo bilingual education programs to assess Navajo language proficiency at the primary level. THE 1980’S The 1980’s were very active regarding the evaluation of Indian education. However, the reports were not published for public or government consumption. The House Appropriations Committee was concerned about the quality of academic education provided by “Contract Schools,” which were referred to as ‘Indian Controlled Schools.” These schools had been Federal under the BIA and with the passage of P.L. 93-638 the BIA was provided authority to contract its programs or parts of programs to Indian tribes so they could administer them. Also, the House Education and Labor Committee had created a sub-committee which was very active in developing legislation regarding Indian education. Reports pertaining to the various Congressional committees can be found in memos and committee reports. Navajo Indian Controlled Schools Position Paper (1987). This position paper was never published yet it contained excellent documentation of the pressures the House Appropriations Committee was putting on the Indian controlled schools. This Committee was using achievement tests to measure the education programs of the schools. This same design is being used. Attachments to the Navajo Position Paper narrative were memos which established an official “Achievement Test Policy.” A memo by Dr. Kenneth Ross clearly referenced congressional committees as the motivation for the BIA Achievement Test policy. The culmination of this activity was a January 23, 1987 memo from the “Deputy to the Assistant Secretary/Director - Indian Affairs (Indian Education Programs.) The first paragraph of the memo stated:
This is a long and detailed memo which assigns the Office of Indian Education Programs (OIEP) responsibility for “collection, aggregation, and dissemination of Bureau-wide test information.” After researching to locate documentation related to this task it is highly probable that it was never carried out by the OIEP. At that time, 1987, the BIA Navajo Eastern Agency implemented a program to respond to the House Appropriations Committee’s pressure. Curiously enough, the Eastern Navajo Agency assessment program, which cast achievement tests as its foundation, was presented as a total BIA Education assessment program, which it was not. The Eastern Navajo Agency used achievement tests (CTBS) to retain students; evaluate teacher quality and assess their academic program. In response to this program, Navajo contract schools hired Jim C. Fortune (1987) to evaluate the Eastern Navajo Agency assessment program. Fortune established a control group from a North Carolina public school that had 12 percent Indians in its membership. Fortune used a research design and was very careful about data quality and statistical procedures. Fortune used “t” tests of significant differences, means, standard deviations and a two way ANOVA. He used the normal curve equivalent (NCE) rather than the test grade equivalent because the NCE is more stable. His “Purpose of Study” could have been instructive to the Congress and the BIA. It described how most achievement tests are constructed:
Fortune found that about all of Eastern Navajos claims, i.e. that retaining students was a motivator for increased achievement, were fallacious. The Navajo Position paper also discovered that Eastern Navajo’s outstanding teacher handed out to students actual pages of the tests and taught the children correct answers just prior to administration of the CTBS. It is interesting that neither the Congress or the BIA bothered to investigate their rich historical heritage of the use of standardized tests and their basic cultural unfairness. Ignorance ruled the day, as it does today. Evaluating Indian Controlled Schools. It was mentioned above that the House Appropriations Committee was concerned about the quality of Indian controlled schools’ education. The Committee financed an education evaluation contract to Abt Associates, Inc. (1985) to assess the quality of the education program in Indian controlled schools. The evaluation design was elaborate and considerable effort was made to be fair to the schools. For purposes of comparisons, BIA and public schools were included. The evaluation included grades eight and twelve. The total database included School Characteristics, Student Background Characteristics, Achievement Tests, Attendance, Costs and Department of Education Title IV Enrichment Projects. At the eighth grade level the evaluation included 20 Indian controlled schools, two BIA schools and 10 public schools for a total of 581 students. At grade twelve they included 26 Indian controlled schools, 3 BIA Schools and seven public schools and 455 students. Several statistical procedures were applied to the data. The report summary stated:
The elaborate design notwithstanding, the evaluation did not prove the inferiority of Indian controlled schools. In all respects, it was a fair attempt to respond to the needs of the House Appropriations Committee. Here, again, we find a concern for the education quality differences between school types. The design matched student types, similar to the design of the Bass evaluation, and concluded with only some differences. When students are matched according to background characteristics, few differences can be expected between school types. The same as with the National Study of American Indian Education conducted by Havighurst and Fuchs, this evaluation was also important because the contract was managed by the U.S. Department of Education, Office of Indian Education, not the BIA. It should be noted from above that one of the stipulations was to provide evaluative information pertaining to Title IV, Enrichment Projects, which were funded by the Office of Indian Education. This is a somewhat unusual situation because a Department other than Interior was funded to evaluate an Interior Department program. This is not often done in U.S. Government Education activities. Gifted Attitude Inventory for Navajos. Up to 1980 there had been very few instruments that tried to provide an education dimension which was based on an Indian culture. The Dinè Bi'Olta' Research Institute, a Navajo organization headed by Dillon Platero, obtained a grant from the U.S. Department of Education, Office of Indian Education to develop the “Gifted Attitudes Inventory for Navajos (GAIN)” (Abbott, about 1982). GAIN was piloted on 101 Navajo high school students and statistics were developed to reflect this activity. GAIN was designed for “adolescents in grades nine through twelve, or between the ages of approximately thirteen through nineteen.” The inventory consists of 66 items for which there were no right or wrong answers. Each school was encouraged to develop their own statistical profile. GAIN was used at the Navajo Academy in 1986 (Platero, 1986) to help identify gifted and talented students. The statistical output did approach a normal distribution starting at the 21st percentile and going upward. GAIN has eight sub-categories:
The higher the GAIN raw score, the higher the student reflects Navajo intelligence and culture. GAIN could probably be used today as one of the background characteristics to assist in matching Navajo students and in weighting standardized test scores. It would be interesting to run correlations and regressions which included GAIN scores. While working at the Navajo Academy, Hopkins (1986) administered GAIN to 170 Navajo Students in the spring of 1986. He created a comprehensive database which included all the GAIN data as well as CTBS scores in Reading, Language Arts, Math and the Ottis-Lennon School Abilities I.Q. test. He ran correlation’s on the CTBS, Lennon and GAIN data and found a weak relationship between the standardized instruments and GAIN, His correlation matrix follows. Correlation Matrix
PERCTILE 1.000000 Figure 7 McGraw Hill 1985 Report BIA Standardized Testing Program, 1980-1987. Though not published, the 1980’s were busy. The BIA contracted with McGraw Hill to test some of its students. McGraw Hill provided BIA a report each year. The 1985 report seemed to be available more than other years (USBIA, 1985; Hopkins, 1987). Only an unspecified sample of students were tested in the spring of the school year. 15,097 took the CTBS and 5,539 took the CAT for a total of 20,636, which would be less than half the BIA total number of students. It can only be assumed that students were not tracked and cohorts were used for statistical purposes. When test norms were used, the same pattern established by the University of Chicago is repeated i.e. growth is good in lower grades and falls behind until grade 12 Indian students are two test grade levels behind. The report was prepared by CTBS McGraw Hill. They issued a word of caution about the CTBS being harder than the California Achievement Test (CAT). It seems that the scores were going up on the CTBS so they made it harder. This means that the bell curve dominated testing rather than student learning. The CAT, so they said, was easier than CTBS as it had not been changed. This report clearly reflects that the priority of the education psychologists at McGraw Hill placed a higher priority on statistical output than on student learning. When combined with an earlier McGraw Hill specialist who recommended that under no circumstances should the time to take a sub-test be changed it is clear that standardized tests and their use of the years with Indian students are fundamentally flawed. THE 1990’s Deyhle and Swisher (Op.cit. 1997) made Indian Self-Determination a major theme in their review of research literature. Their understanding of the education situation was that schools taught assimilation to Indian children. There is no doubt that individual non-Indian teachers have, contrary to program policy, been taught in such a manner to reflect assimilation. There is also little doubt that most textbooks used in Indian classrooms were and are Eurocentric based. Also, with the vast majority of American Indians now being educated in public schools, Indian Self-Determination does not apply. Public schools, alone, may represent a tacit program of assimilation through education. Interestingly enough, the 120 BIA funded contract and grant schools may represent the only non-assimilation schools in the U.S. and they are but a very small proportion of the total. Regarding assimilation as an education policy, officially, it has not been a BIA policy since the 1930’s. Nor has it been the policy of the U.S. Department of Education’s Office of Indian Education. Nonetheless, with few Indian teachers, it may be a major purpose of teachers. Indian Professional Education Researchers. There are now hundreds, perhaps thousands of professional educators who are Indian. Compared to 1940 when the entire Peterson evaluation took place without a single Indian in a decision making position, there has been a sea change in the education of Indians. We cited above an evaluation report reflecting the BIA’s paying for the higher education of educational administrators, which was in 1975. Many of the individuals who were students in these programs eventually occupied leadership positions in government, public education and higher education. It is important that now all administrative positions in the BIA’s Office of Indian Education Programs are Indian. Indian Teachers. Starting in 1992, the Navajo Nation initiated a Teacher Education Program (Hopkins, 1998). It started as a part of the Ford Foundation Minority Teacher Education Program but is now entirely supported by the Navajo Nation. Since 1992, the program has produced over 600 elementary, Navajo, certified teachers. Gorman (2000) reported that over half the elementary teachers in Navajo Nation schools are now Navajo. Also, there are now a few schools, BIA funded, only, with a total Navajo staff, including administrators, teachers and ancillary staff. The Teacher Education program is still in effect and is gradually producing more new certified teachers. THE 21ST CENTURY Pre NCLBA Evaluation Activities OIEP Evaluation Initiatives. Based on a February 28, 2002 memo from the Deputy Director for School Operations, the Office of Indian Education Programs was, at last, after 15 years, implementing a “Program Review” of Regulations based on P.L. 95-561. Ironically, about 1985 I developed a computer program for implementing the Regulations. I offered the program to the OIEP at that time and was told it was unnecessary as such a computerized program was under development. In time it was rather apparent that no such program was under development. In 2002 the leadership for the Program Review was emanating from the OIEP’s Office of School Operations located in Albuquerque. In reviewing the complete instrument it appears to be very detailed and complete. The various regulations are cited and the program review format relates specifically to them. Professionally, it was an excellent evaluative instrument -- but so far as I could determine, it was never taken seriously by Interior and never used. Navajo Nation Rural Systemic Initiative. This program was funded by the National Science Foundation (NSF) to the Navajo Nation. It started in October of 1998 and concluded in March of 2004. NSF requires an outside evaluation. Patrick Galvin of the University of Utah was the Principal Investigator of the evaluation. Galvin, et. al (2001) using Arizona, Utah and New Mexico test data, provides analyses that are related to control characteristics such as socioeconomic status (SES) and Navajo culture. The focus is on math and science test scores. NSF will accept qualitative evaluations but prefers quantified evaluations. State data is very important to Navajo education as public schools provide approximately 75 percent of schooling for Navajos. All three states have high stakes testing assessment-accountability programs. None of the states identify American Indian students by their culture name, which complicates separating Navajo data from the others. Galvin provides two basic questions which the evaluation attempts to answer: 1. What is the math/science test score achievement gap between Native American and Anglo students? 2. What evidence is there that the test scores of students attending schools supported by NN-RSI programs increase at a faster rate overtime than a comparable group of students not supported by these initiatives? In the Executive Summary to the report, Galvin states:
This evaluation uses extant data and does not gather test data for the stated project purposes. Galvin uses background characteristics (language and socio-economic) in analyses. This evaluation practice, we have learned, always produces data different from that which does not control background characteristics, i.e. the BIA testing program of the 1980’s. There is always more confidence in the evaluation when background characteristics are included in test data analysis. Overall, NN-RSI has generated over 10 evaluation reports, but Galvin’s addresses the achievement gap in such a manner as to relate to contemporary Navajo (American Indian) education. BIA/Interior Implementing The No Child Left Behind Act Under the leadership of William Mehojah, the BIA/BIE initially made a decision to develop their own definition of Adequate Yearly Progress (AYP) (USBIA-NCLBA, 2002). Then, Interior Department administrators stepped in and reassigned Mehojah and placed all BIA funded schools under the state AYP definitions. Since Interior’s decision, the BIA/BIE’s implementation of the NCLBA is a classic example of Government ineptitude lead by political appointees in the Interior Department. The following loose chronicle of the implementation process reflects the ineptitude.
The regulations promulgated by Interior make it appear that the schools themselves opted for the state AYP definitions. Based on my 2004 first-hand experience in conducting four BIA funded Navajo school evaluations, none had been invited to make a decision on doing their own AYP or a total Navajo AYP None made a decision to use the state's AYP. According to the schools they were told by OIEP that they were required to follow the state AYP definition and curriculum. They were not offered any technical assistance regarding the Waiver available to them. In fact, they were hesitant if not fearful of doing their own AYP inasmuch as their budgets were then 35 percent from NCLBA and the threat of loosing this amount was frightening to them. They were very, very cautious to go against the administrative directive to follow the state AYP. GAO Report. The United States Government Accountability Office (2008) was requested by the House Committee on Education and Labor by Committee members Raul M. Grijalva for Arizona and Stephanie Herseth Sandlin of South Dakota to conduct a review of the Interior/BIA’s implementation of the NCLBA. The report picks up on Interior/BIE’s implementation in 2005. It makes no mention about what happened between January 8, 2002 when NCLBA was passed and April 2005 when Interior finalized 25 CFR §30, “Adequate Yearly Progress.” What the GAO found was virtually no communication and/or training of OIEP/BIE Line Offices regarding schools developing their own definition of AYP. The BIE ignored statutory deadline requirements and took months when it was required by law to take days to respond to P.L. 638 proposals. More importantly, the $11 million allocated for technical assistance was spent internally on a “Student Tracking System” (Federal Register 2008). The GAO report lists the mess that is the implementation and Interior’s decision to turn the BIA funded schools over to the states AYP definitions. Since Interior/BIE no longer communicated adequately with schools and tribes, it can be assumed that Interior believed that the schools had become the responsibility of the states. Interior/BIE turned a blind eye on the schools and Interior Trust Responsibilities to provide training and technical assistance. For the three who eventually got a response for BIE, the GAO said:
It is important to note that the tribes seeking to develop their own AYP starting receiving Interior/BIE responses and technical assistance in 2008, three years after the schools were administratively turned over to state definitions of AYP. This could hardly be considered a “Timely Response.” More importantly, it was six years, not months or years, after the enactment of NCLBA in 2002. Some selected GAO findings describe the Interior/BIE incompetent implementation of the NCLBA:
Interior’s NCLBA Decision. Based on my experiences; the written record (GAO report; 25 CFR 30; Tracking System) and Interior’s numerous administratively imposed decisions on the 174 BIA funded Education entities have experienced “Education Shock and Awe.” Just when it was thought that control of Indian/Native education was, via the Indian Self-Determination in Education Act (P.L. 95-561), effectively placed in the hands of those being educated, Interior officials let it be known that historic external control of Indian/Native education was alive and well. It is obvious that Interior thought that administratively requiring (there was apparently no intention of extensive consultation with schools) the NCLBA AYP definition be the same as the states in which the schools are located would be tantamount to making the states responsible for the BIA funded schools. Furthermore, this would involve no funding to the states for technical assistance to the schools. This simplistic notion, in my view and experience, has been a disaster regarding the education of Indians/Natives. NATIONAL INDIAN EDUCATION EVALUATIONS The BIA’s historical negative image notwithstanding, the agency for almost a century has provided leadership in evaluating American Indian education. For the most part all the evaluations are professionally competent. Most importantly, they present cultural differences between Indians and the total U.S. Eurocentric culture and population in a fair and meaningful manner. Except for the 1980’s and the NCLBA, none of the evaluation activities of the BIA that have been cited reflect the goal of Indians through education being assimilated into mainstream U.S. society. There may be research studies at the local school level which clearly describe racism being reflected in classrooms taught by non-Indian teachers (Deyhle, 1995). However, the official policy of BIA has not been assimilation since about 1932. There have been no national evaluations since the Bass evaluation. There never has been a national evaluation that uses the Decennial Census definition, which is used by the U.S. Department of Education, Office of Indian Education. 1 The general background for this article uses extensively Hopkins (2002).
Occasionally,
without citation, our text includes knowledge and experiences from Hopkins. For
example, Hopkins worked
face to face with Madison Coombs from 1959 to 1970. More than a few times, he
had extensive conversations
with Estelle Fuchs and was a first-hand observer of the Rock Point bilingual
program and the
creation of Rough Rock. REFERENCES Abbott, Judith A. “The Gifted Attitudes Inventory for Navajos,” The Diné Bi'Olta Research Institute, Farmington, N.M.: 1200 West Apache Street. “directors for Administering and Scoring the GAIN,” undated, 14pp. Abt Associates, Inc., An Evaluation of Indian Controlled Schools, Cambridge, Mass, Sept. 6, 1985, Draft of the Final Report, 114 pp. Anderson, Dewey H. & Eells, Walter C. (1935) Alaska Natives, a Survey of Their Sociological and Educational Status. Stanford University Press, 1935. Anderson, Gary L. (2002), "Reflecting on Research for Doctoral Students in Education, Educational Researcher, Vol. 31, No. 7, pp. 22-25. Anderson, Kenneth E., Collister, E. Gordon & Ladd, Carl E. (1953) The Educational Achievement of Indian Children. Lawrence, KS: Haskell Institute Print Shop, March, 1953. Bass, Willard P. (1971) "An Analysis of Academic Achievement of Indian High School Students In Federal and Public Schools," Albuquerque: Southwestern Cooperative Educational Laboratory May, 1971, 142 pp. Boyce, George A. (1974) When Navajos Had Too Many Sheep: the 1940's. San Francisco: The Indian Historian Press, 1974. 273 pp. Boyce was head of BIA Education, Navajo Reservation, 1940's. Bracey, Gerald W., (2002) "Test Scores, Creativity, and Global Competitiveness," Phi Delta Kappan, Vol. 83. No. 10 June 2002, pp. 738-739. Briere, Eugene J.(1969) "English Language Testing project for the Bureau of Indian Affairs," Los Angeles: University of Southern California, 1969, 15 pp. Briere, Eugene J. (1970) "Testing ESL Skills Among American Indian Children," from Report of the Annual Round Table Meeting On Linguistics and Language Studies. James E. Alatis, Editor, Washington, D.C., Georgetown University Press, 1970. Bryde, John F.(1970) The Indian Student. Vermillion: Dakota Press, 1970. Capps , Ethel (1977) "Reading Levels for High School Graduates," BIA Education Research Bulletin, September 1977,Vol. 5, No. 3, pp. 25 - 32. Code of Federal Regulations, Title 25, Part 30, “Adequate Yearly Progress” finalized April 28, 2005. Coleman, James S..(1969) Equality of Educational Opportunity. Washington, D. C.: U.S. Government Printing Office, Report OE-38001, 1966, 737 pp. Coombs, L. Madison. (1958) The Indian Child Goes to School: a Study of Interracial Differences. Lawrence, Kansas: Haskell Institute Print Shop. U.S. Bureau of Indian Affairs, 1958. D'Augostino, Jerome V. (2000) "Achievement Testing in American Schools,” Thomas L. Good, Editor, American Education Yesterday, Today and Tomorrow, National Society for the Study of Education, 2000 Yearbook, Part II, pp. 313 -337. Deyhle, Donna, (1995) "Navajo Youth and Anglo Racism: Cultural Integrity and Resistance," Harvard Educational Review, Vol. 65, No. 3 (Fall 1995). Deyhle, Donna and Swisher, Karen, (1997) "Research in American Indian and Alaska Native Education: From Assimilation to Self-Determination," Review of Research in Education, 1997. Washington, DC: American Educational Research Association, 1997, pp. 113-194. Federal Register, Department of Interior, Bureau of Indian Affairs, Privacy Act of 1974, as amended of an Existing System of Records.” “Indian Student Records.” This notice describes the Student Tracking System, information categories and access. Fortune, Jim C.(1987) , "An Analysis of the Potential Effects of an Achievement Test Based Student Retention Policy on School Evaluation Efforts," Blacksburg, Virginia: Research Consulting Services, October 5, 1987, 12 pp. Fuchs, Estelle and Havighurst, Robert J. (1972) To Live On This Earth, American Indian Education. Garden City, New York: Doubleday & Co., 1972. Galvin, Patrick; Hausman, Charles; Hopkins, Thomas R., (2001) “Examining Math and Science Achievement for Native American Students Over a Three Year Period, 1998, 2000,” University of Utah, May 2001, 29pp. Goodenow, Ronald K. (1980) "The Progressive Educator and American Indians," History of Education Quarterly. (Summer 1980), pp. 207-216. Gorman, Roxanne. (2000) "Navajo Teacher Education," a paper presented to the New Mexico Teacher Education Round Table, Gallup, N.M. May 2000, mimeo. Havighurst, Robert J. (1957) "Education Among American Indians: Individual and Cultural Aspects." The Annals, 311 (May1957), pp. 105-115. Haywood Metz, Mary and Page, Reba N. (2002) "The Uses of Practitioner Research and Status Issues in Educational Research: Reply to Gary Anderson,” Educational Researcher, 2002, Vol. 31, No. 7, pp. 26-27. Hopkins, Thomas R. (2002) “An Autobiographical Approach to Evaluating American Indian Education,” Albuquerque: Research and Management Specialists, Inc. 2002. Hopkins, Thomas R. (1998) "The Navajo Nation Ford Teacher Education Program, Evaluation of the Program," Albuquerque: Research and Management Specialists, nine reports from 1992 through 1998. Hopkins, Thomas R. (1986), “Administration of GAIN at the Navajo Academy,” Albuquerque: Research and Management Specialist, Inc. 1986, mimeo. Hopkins, Thomas R. (1987),"Update On Indian Education, 1987," Albuquerque: Research and Management Specialists, February 1987, 38 pp. Hopkins, Thomas R. (2007) “An Annotated Bibliography of the BIA Education Research Bulletin.” Alaska Native Education Network, University of Alaska, Fairbanks, http://ankn.uaf.edu/Curriculum/Articles/History/TomHopkins/BIA/Hopkins2007.html. The “Annotated Bibliography”, only, is available on-line. The articles may be requested from Dr. Hopkins at <rmsweb@comcast.net>. Johnson, Broderick H. (1968), Navaho Education At Rough Rock. Rough Rock, AZ: Rough Rock Demonstration School, 1968. Martin James C. (1977), "Self Esteem and Locus of Control as Predictors of Indian Student Attitude Toward School," BIA Education Research Bulletin, May 1977,Vol. 5, No. 2 pp. 15-20. Martin James C. (1979), "Focus of Control and Self-Esteem in Indian and White Students," BIA Education Research Bulletin, January 1979, Vol. 7, No. 1, pp. 22 28. Meriam, Lewis. (1928) The Problem of Indian Administration. Baltimore: The Johns Hopkins Press, 1928, 872 pp. See Chapter IX, “Education,” pp. 346-429. Navajo Position Paper (1987) on, "Proposed Imposition of BIA Test Policy on Contract Schools," Window Rock, AZ. A draft copy, probably 1987, undated, 6 pp. Includes BIA memos and related documents. Peterson, Shailer. (1948) How Well Are Indian Children Educated? Lawrence, KS: Haskell Institute Print Shop, Sept. 1948. Philp, Kenneth R. (1981) John Collier's Crusade for Indian Reform, 1920 - 1954, Tucson: The University of Arizona Press, 1981 304 pp. Platero, Dillon, (1986) “Gifted Attitudes Invenory for Navajos (GAIN), Using GAIN to Identify Givted and Talented Navajo High School Students at the Navajo Academy, Farmington, N.M. : Navajo Academy, May 9, 1986, 25 pp. Pray, Bruce S. (1975) "The Use of Standardized Tests With High School Indian Students," BIA Education Research Bulletin, September 1975, Vol. 3, Resta, Paul E. and Hopkins, Thomas R. (1984), American Indians In Higher Education, Albuquerque: University of New Mexico, 1984, 146 pp. Rosenbluth, Annabelle Scoon, (1975) "The Feasibility of Test Translation English to Navajo," Dissertation Abstract, University of New Mexico, BIA Education Research Bulletin, January 1975, Vol. 3, No. 1, pp. Rosier, P., and Holm, W. (1980) The Rock Point Experience: A Longitudinal Study of a Navajo School Program. (Bilingual Education Series No. 8) Washington, D.C.: Center for Applied Linguistics, 1980. Rosier, Paul and Farella, Merilyn. (1976) "Bilingual Education of Rock Point--Some Early Results," TESOL Quarterly, vol. 10, (4 December 1976) pp. 379-388). Sahmaunt, Dan, (1979) "Survey of Off-Reservation Boarding Schools in the Bureau of Indian Affairs - A Committee Report", BIA Education Research Bulletin, January 1979, Vol. 7, No. 1, pp. 2-15. Schoenfeld, Alan H. (2002) "Making Mathematics Work for All Children: Issues of Standards, Testing and Equity," Educational Researcher, Vol. 31, No. 1,(January/February 2002, pp. 13-25. Slavin, Robert E., (2002) "2002 Dewitt Wallace-Reader's Digest Distinguished Lecture, Evidence-Based Education Policies: Transforming Educational Practice and Research" Educational Researcher, 2002, Vol. 31, No. 7, pp. 15-21. Squire, James R. (Editor) (1972), A New Look At Progressive Education. Washington, DC: Association for Supervision and Curriculum Development, 1972 Yearbook of ASCD, 392 pp. Szasz, Margaret. (1977) Education and the American Indian: The Road to Self- Determination, 1928-1973. Albuquerque: University of New Mexico Press, 1977, 252 pp. Tyler, S. Lyman. (1973) A History of Indian Policy. U.S. Department of the Interior, Bureau of Indian Affairs. Washington, D.C.: U.S. Government Printing Office, 1973. United States Government Accountability Office (2008), “Bureau of Indian Education Schools. Improving Interior’s Assistance Would Help Some Tribal Groups Implement Academic Accountability Systems.” GAO-08-679, June 2008, 38 pp. USBIA, (2002), "Educational Assessment Program Report, School Year 2000-01" Washington, DC: U.S. Bureau of Indian Affairs, Office of Indian Education Programs, posted on the web site, PDF file, 187 pp. USBIA, (1985) "Technical Review of 1985 Testing Data, Narrative Evaluation of 1985 Spring Testing Data," McGraw Hill Testing Report, Comprehensive Tests of Basic Skills and California Achievement Tests, September 1985, 141 pp. USBIA, (1979), “Research and Evaluation Report Series,” U.S. Bureau of Indian Affairs, Indian Education Resources Center, Albuquerque, NM: there are 47 numbered publications many are available at researchandmanagement@swcp.com. USIBA, Navajo Area (1970), "Status Report of the Navajo Area Testing Program, 1964 - 1967. Window Rock, AZ. 1970, mimeo, 29 pp. U.S. Census Bureau, (2002) "The American Indian and Alaska Native Population: 2000," Census 2000 Brief, Issued February 2002, 12 pp. U.S. Senate Report, (1969) Indian Education: a National Tragedy-- a National Challenge. Washington, D.C.: U.S. Government Printing Office, No. 91-501, 1969. The Kennedy Report. Window Rock Public Schools (1981), “Window Rock Oral Language Test, Navajo/English Bilingual Proficiency,” 1981. Appropriate for ages 4-7. Main individual involved, Marie Ariviso, Herbert Harvey and Pauline Hildreth, plus many others who are listed. Zintz, Miles V., (1969) Education Across Cultures. Debuque, Iowa: Kendall/Hunt Publishing Co. 1969, 2d Edition, 542 pp. * I wrote most but not all of this Chapter in 2003 and have updated it for the Alaska Native Knowledge Network. ** Raw or untreated scores. *** Dr. Benham joined the BIA Education program in 1950 and worked under Dr. Beatty and then Hildegard Thompson. In his several leadership positions, he always supported strong inclusion of Indian/Native culture in education evaluations.
|
||||||||||||||||||||||||||||||||||||||||||||||||||||||